
Solar Irradiance Surges in 2026: Global Trends & What It Means for Israel

Solar irradiance is up 5‑10% above average in large parts of Europe, the U.S., Southeast Asia and Central Africa during the first half of 2026
The Solcast weekly update – a DNV‑owned analytics platform – shows that, between January and June 2026, solar resource was broadly 5‑10 % higher than the long‑term baseline across Europe, the United States, Southeast Asia, South America and Central Africa. The boost came from a transition from early‑year blocking and polar‑vortex disruption to a developing El Niño that began in April. By contrast, Canada, Mexico, South Africa, North Africa, western Russia and Central Asia recorded 5‑10 % deficits. These figures are derived from Solcast’s high‑resolution (1‑2 km) satellite‑based irradiance model, which carries a typical bias of less than 2 %.
Europe enjoys a record‑high solar surplus, with France +13 % and Austria up to +25 % above the 2007‑2025 baseline
Winter 2025‑26 brought cold, dry air over eastern and northern Europe, stripping away clouds and lifting irradiance even as storms pushed the deficit westward. A persistent high‑pressure ridge over the North Sea in April kept skies clear, delivering France +13 %, Germany +11 %, and Finland +16 % above the historic average. May’s clear‑sky belt stretched from Spain to Ukraine, with Austria seeing the strongest anomaly – up to +25 % above normal. The surplus translated into longer, higher‑output days for solar farms across the continent, offsetting localized soiling from recurring Saharan dust events that still intermittently dimmed the sun.
United States sees mixed results: overall above‑average but regional drops in Texas, the Gulf Coast and California’s Central Valley
The first quarter of 2026 delivered a string of clear‑sky periods across the central, eastern, southern and western U.S., lifting generation after a late‑January storm‑induced dip. From April onward, the pattern split: interior markets stayed near or above average, while Texas and the Gulf Coast experienced below‑average irradiance due to increased moisture, cloud cover and rainfall. In California, persistent tule fog in the Central Valley also drove a short‑term deficit. The shift matters for ERCOT, where the early‑year surplus helped meet demand, but the later regional shortfalls will pressure grid operators to balance with storage or imports.
Asia’s solar story flips with the El Niño: early‑year gains in southern China, then a May swing to coastal East Asia
January‑February 2026 gave southern and coastal China a bright start – Hong Kong recorded > 25 % above average in January, and Taiwan stayed above baseline in February. By April, the strongest gains moved southward into Southeast Asia, where Bangkok logged its sunniest April since 2007. Simultaneously, the Yangtze Delta fell ≈ 10 % below average as cloud and rainfall intensified. May saw another reversal: clear skies returned to coastal East Asia, while other parts of the region again faced cloud‑driven deficits. This seesaw reflects the evolving El Niño‑driven circulation that reshapes monsoon patterns across the continent.
South America and Australia face extreme‑event volatility: wildfire smoke, cyclones and dust cut solar output
In South America, wildfire smoke in January slashed irradiance by up to 15 % in northern regions, even as surrounding areas enjoyed clearer skies. Further south, hotter, drier conditions lifted irradiance in central Chile. Australia’s central interior suffered 15‑30 % deficits during February’s record‑wet month, driven by Cyclone Mitchell and later Cyclone Narelle, which also spread dust and cloud across Queensland, the Northern Territory and Western Australia. Coastal zones, however, saw intermittent bright periods, underscoring the stark inland‑coastal contrast.
Why the 2026 solar swing matters for investors and grid planners
Solcast’s AI/ML‑driven irradiance forecasts are now used by more than 350 companies managing over 300 GW of solar assets globally. The first‑half 2026 patterns highlight how quickly regional weather regimes can shift – from blocking to El Niño – and how that translates into 5‑10 % swings in expected generation. For developers, these swings affect project economics, financing terms and the sizing of storage or backup resources. For grid operators, the variability stresses the need for flexible demand‑response and cross‑border power flows, especially where regional deficits line up with peak load periods.
What it means for Israel’s rooftop solar owners
Israel’s residential solar market typically enjoys a ~₪0.48/kWh feed‑in tariff and an installation cost of ≈ ₪3,150/kWp. Using the typical central‑Israel yield of 1,700 kWh/kWp / year, a 10 kWp home system would generate ≈ 17,000 kWh annually, worth ≈ ₪8,160 at the current tariff. During El Niño‑influenced periods, irradiance in many sunny Israeli regions can be modestly higher than the long‑term average, leading to a slight increase in annual output and a modest improvement in payback time for homeowners.
For commercial or municipal installations, the same uplift translates into larger absolute savings because of higher installed capacities. The takeaway: El Niño‑linked irradiance increases can provide a modest boost to revenue and shorten payback periods, reinforcing the financial case for expanding rooftop solar in Israel, especially as the nation pushes toward its 30 % renewable electricity target by 2030.
Looking ahead: monitoring El Niño’s evolution and preparing for the next solar swing
Solcast’s models indicate that the developing El Niño will strengthen through the remainder of 2026, potentially extending the 5‑10 % irradiance boost into the summer months for many regions. Stakeholders should keep an eye on the monthly Solcast outlooks and incorporate the forecasted variability into financial models, storage sizing, and grid‑balancing strategies. In Israel, where solar already supplies a growing share of electricity, the upcoming El Niño could provide a timely lift, helping meet the 2030 renewable target while delivering faster ROI for new rooftop projects.
For a deeper dive into solar ROI calculations, visit our solar ROI calculator. For up‑to‑date market data, see our solar market data page.
Sources & further reading
FAQ
Which regions saw the biggest solar irradiance increase in early 2026?
Europe (up to +25 % in Austria), the United States (overall above average), and Southeast Asia (up to +25 % in Hong Kong) recorded the strongest gains.
How does El Niño affect solar generation?
El Niño reshapes global weather patterns, often creating drier, clearer skies in some regions (raising irradiance) while bringing more cloud and rain to others.
What impact did wildfire smoke have on solar output?
In South America, wildfire smoke cut irradiance by up to 15 % in affected areas, offsetting otherwise clear‑sky conditions.
How much can an Israeli 10 kWp rooftop system earn during an El Niño‑boosted year?
With a typical 1,700 kWh/kWp yield, a 10 kWp system makes ~17,000 kWh. An 8 % El Niño boost raises that to ~18,400 kWh, worth about ₪8,830 annually.
Will the 2026 El Niño continue into the summer?
Solcast forecasts suggest the El Niño will strengthen through the rest of 2026, likely extending the irradiance uplift into the summer months.
Share this post
More from Technology
6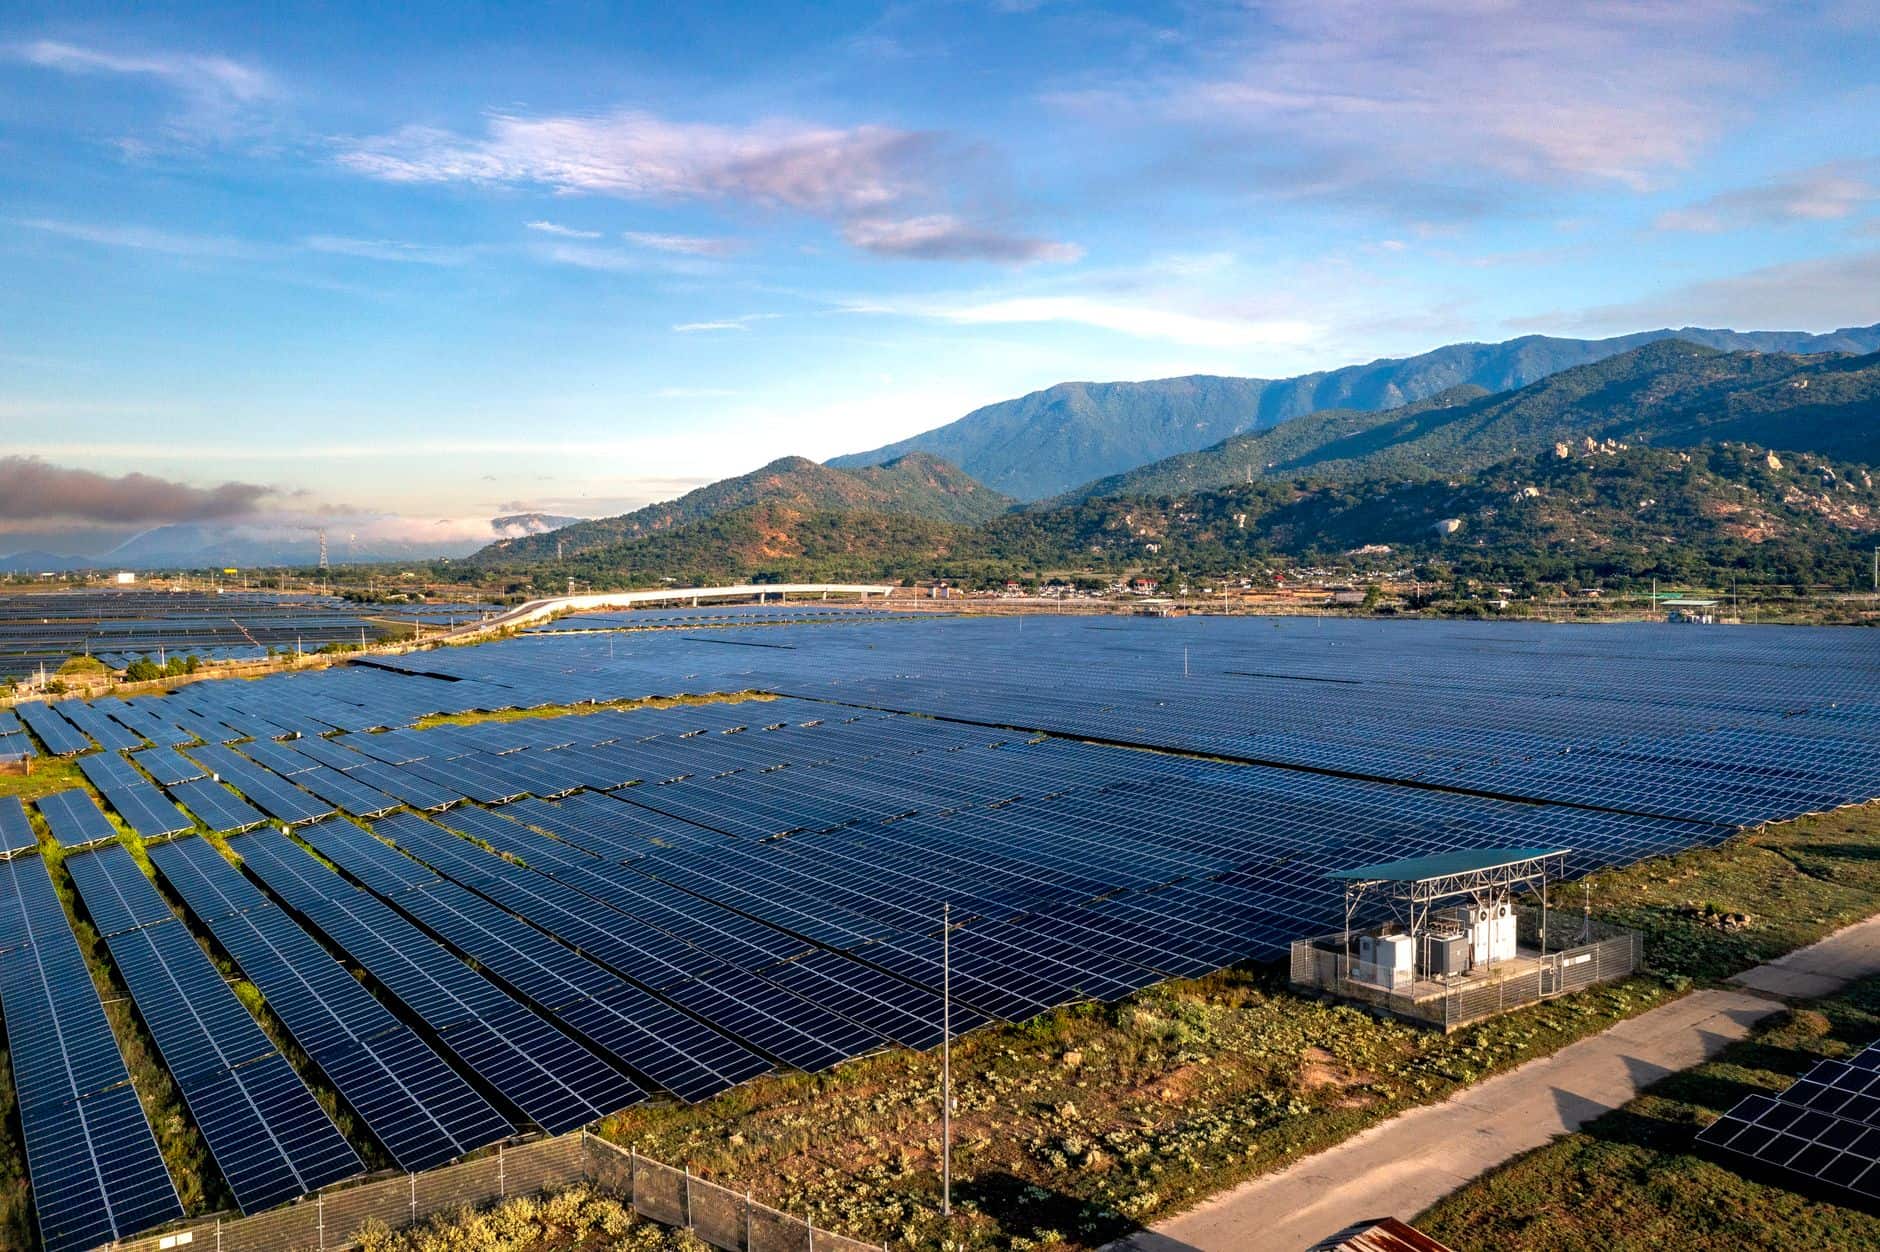
Bhutan Gets $160 M Boost for 310 MW Solar
Bhutan secured a US$160 million ADB loan to build three solar farms totaling 310 MW, its first private‑majority PPP in the energy sector, aiming to cut imports and create green jobs.
Australia’s 50 MW Green Hydrogen Hub Approved
Orica has secured A$432 million to build a 50 MW green‑hydrogen hub in New South Wales, which will produce about 4,700 tonnes of hydrogen per year and illustrate the scale of clean‑energy projects that can support Israel’s renewable‑energy targets.


Predictive Tracker Tech Boosts Solar Yield
Sunner’s True Wind predicts tracker galloping in real time, reducing wind‑related downtime and modestly boosting solar output.
Africa’s Largest Floating Solar Plant Online
Morocco’s new 13 MW floating solar plant on the Oued Rmel Dam is Africa’s largest FPV installation, delivering clean power to the Tanger Med port and showcasing how flexible anchoring can handle 30‑plus‑metre water‑level swings.

Solar Panel Waste Turned Into Battery Power
Indian researchers have cracked a method that recovers 97.75 % of silicon from dead solar panels and turns it into high‑performance lithium‑ion battery electrodes.