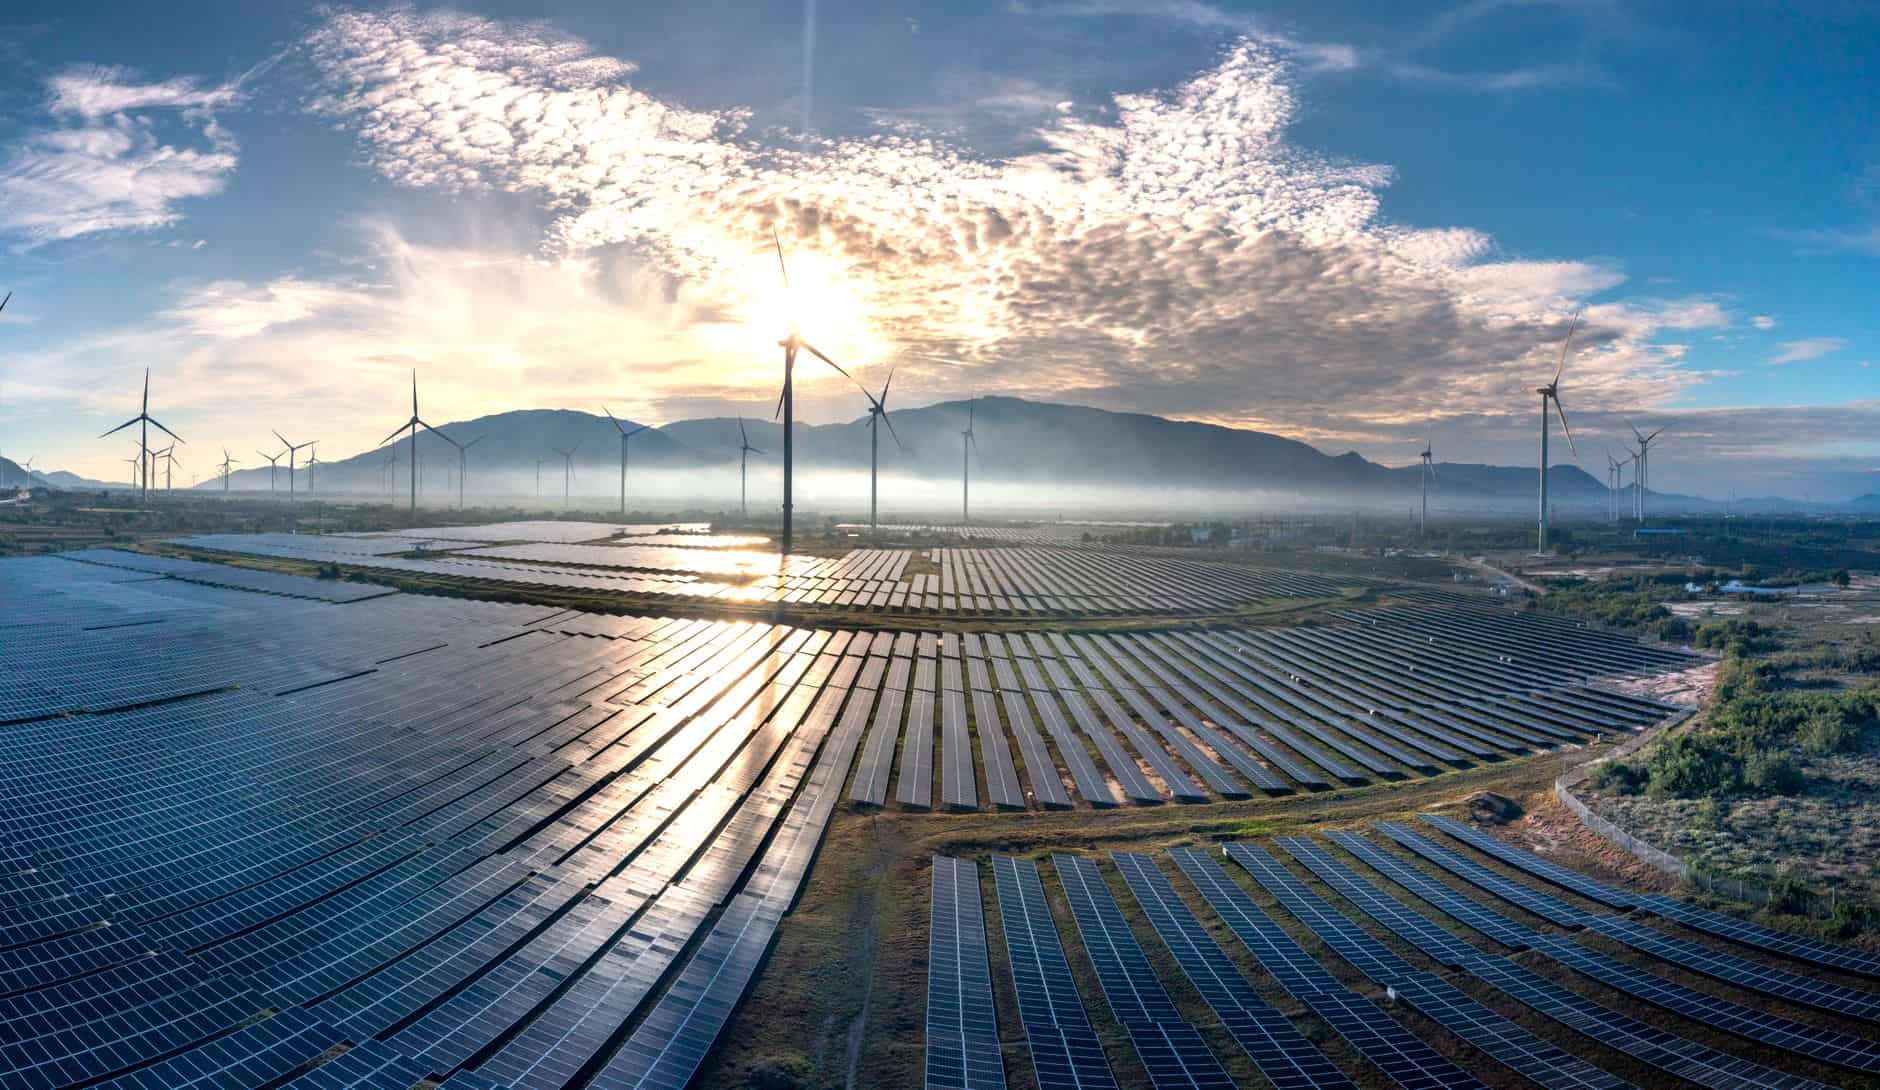
Australia's Renewable Surge Hits Record 9.1 GW
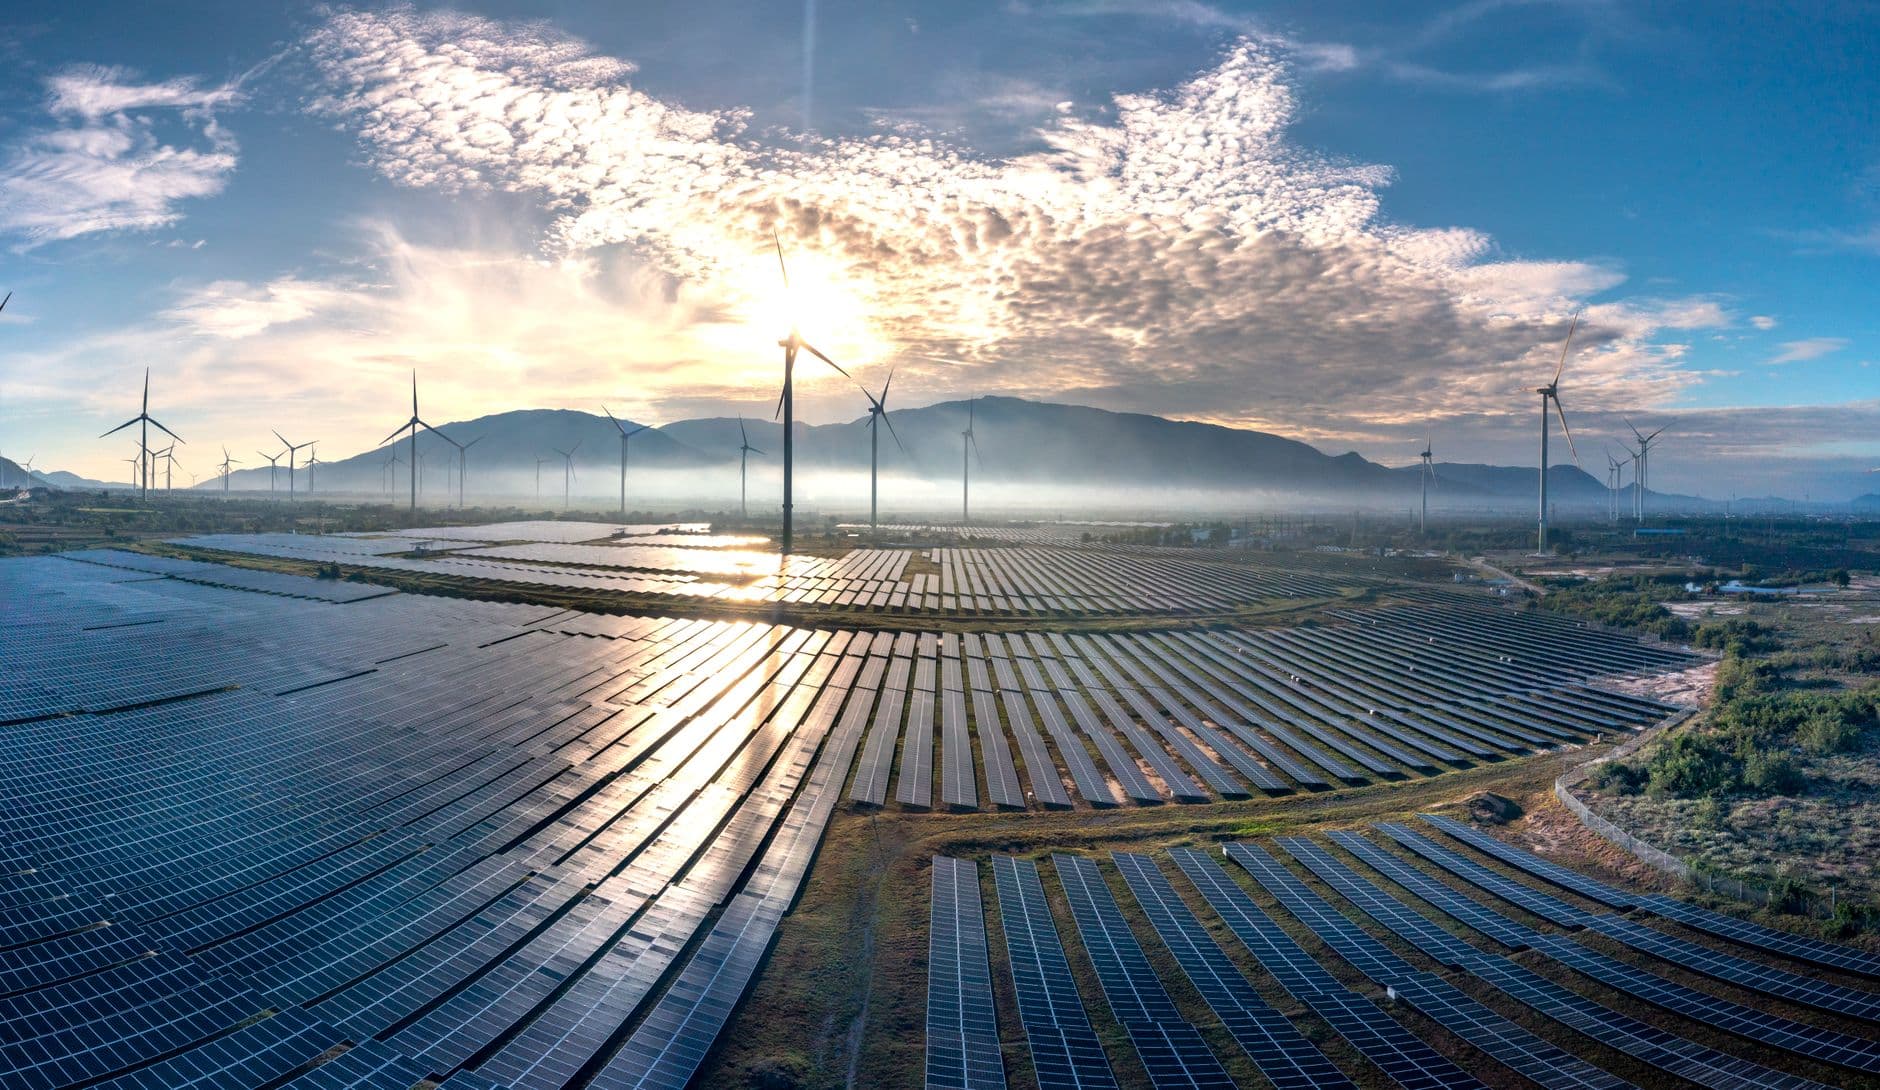
Record‑breaking FY 2025/26 for large‑scale renewables
Australia’s National Electricity Market (NEM) saw a historic 9.1 GW of new solar, wind and battery capacity reach full output in the 2025/26 financial year – more than double the 4.4 GW delivered the year before. The figure comes from AEMO’s Connections Scorecard and marks the strongest single‑year completion record for the market.
Solar, wind and battery mix delivered in the June quarter
In the June 2024‑25 quarter, 3.9 GW of projects were commissioned, including 400 MW of stand‑alone solar, 500 MW of co‑located solar‑plus‑battery, 2.7 GW of stand‑alone battery storage and 200 MW of wind. These numbers show that battery storage now accounts for the majority of new capacity, while solar‑plus‑battery hybrids are becoming a mainstream development model.
Applications and registrations keep climbing
AEMO recorded 32 project applications totalling 6.9 GW of capacity during the year, and eight projects (1.5 GW) moved into the registration stage. Overall, 14.2 GW of applications (31.1 GWh of storage) were approved, while 7.4 GW (14 GWh) progressed through registration. The pipeline therefore grew 42 % to 75.4 GW of potential connections, underscoring a booming pipeline despite later‑stage bottlenecks.
Battery projects dominate the pipeline
Standalone batteries made up 52 % of total capacity in the connections pipeline, according to AEMO’s scorecard. Hybrid solar‑plus‑battery projects represented 18 % (4.3 GW) of applications, and 2.4 GW of solar projects added a battery component during the year. This reflects a clear industry shift toward flexible, dispatchable renewable assets.
Delays are lengthening the pro‑ponent implementation stage
The median time to move a project through the pro‑ponent implementation phase rose from 14 to 18 months, with one‑third of projects lingering for more than two years. AEMO attributes the slowdown to design changes, equipment swaps, sales of projects and extended financing negotiations.
Falling battery costs boost economics
Industry analysis shows battery storage costs are on a steep decline, with BloombergNEF projecting a new low for utility‑scale batteries by 2025. Lower capital costs are expected to accelerate the deployment of hybrid solar‑battery sites and improve the overall economics of large‑scale storage.
What it means for Israel
For Israeli homeowners and businesses, the Australian surge illustrates how quickly battery‑augmented solar can become mainstream. Using typical Israeli figures (₪0.48 /kWh residential tariff, ₪3 150 /kWp install cost, 1 700 kWh/kWp annual yield in the central region), a 15 kW rooftop system would generate about 25 500 kWh per year – worth roughly ₪12 240 in electricity savings. At a total install cost of ₪47 250, the simple payback remains around 3.9 years, similar to a 10 kW system because cost‑per‑kW and revenue‑per‑kW scale linearly. Adding storage could further improve bill savings and provide grid‑stability services, offering a compelling business case for investors and utilities alike. Readers can explore our own ROI calculator [/calculator] and market data [/data] for a deeper dive.
Outlook for the NEM
AEMO expects the expanding pipeline to keep feeding new capacity into the NEM, with hybrid solar‑battery projects set to become a larger share of future connections. Continued cost reductions in battery storage and supportive policy frameworks will be key to maintaining the momentum and avoiding the implementation delays that have begun to lengthen.
Sources:
- AEMO Connections Scorecard (FY 2025/26) – original PV Magazine report
- Detailed scorecard data from AEMO’s public PDF (https://www.aemo.com.au/-/media/files/electricity/nem/network_connections/connections-scorecard/2025/december-2025.pdf?rev=f3500ccda9c74d45b3f894256f9647aa&sc_lang=en&hash=2C028BB17D26B431B0A96AC9CCBB6209)
- Pipeline analysis from AEMO’s newsroom release (https://www.aemo.com.au/newsroom/media-release/batteries-continue-to-dominate-nem-connections-as-pipeline-grows)
- Market‑size and cost trends from PV‑Tech (https://www.pv-tech.org/aemo-australias-nem-sees-connections-pipeline-grow-to-50gw/)
- Battery‑cost outlook from Arche Energy (https://archeenergy.com.au/the-cost-of-battery-storage-is-falling-fast-what-it-means/)
Sources & further reading
FAQ
How much new renewable capacity was connected in Australia in FY 2025/26?
AEMO reports that 9.1 GW of solar, wind and battery projects reached full output, more than double the previous year.
What share of the Australian connections pipeline is battery storage?
Standalone batteries account for 52 % of total capacity in the pipeline, according to AEMO’s scorecard.
How fast are battery costs falling in Australia?
BloombergNEF predicts utility‑scale battery costs will hit a new low by 2025, accelerating hybrid solar‑battery deployments.
What does the Australian surge mean for Israeli rooftop solar owners?
It shows that with current Israeli tariffs and install costs, a 15 kW system pays back in about 3.9 years, and adding storage could cut peak‑hour bills by 30‑40 %.
Are project delays becoming a problem in the NEM?
Yes – the median pro‑ponent implementation time rose from 14 to 18 months, with one‑third of projects stuck for over two years.
Share this post
More from Markets
6
Solar, Batteries Defy Global Shock Costs
GenCost shows solar PV and battery costs keep falling despite global crises, driving Australian wholesale prices from a peak of AU$189/MWh down to AU$60‑80/MWh, while gas turbines and wind face rising costs.
India's Solar Leap: From Imports to Exports
India has transformed from a solar‑component importer to a $2 billion PV‑module exporter, thanks to the Production‑Linked Incentive scheme and strict local‑content rules.
South Korea’s 1 GW Solar Tender Hits Record Low
South Korea’s new 1 GW solar tender caps bids at KRW 147,686/kWh (≈ $99.46 /MWh), a 5 % drop from last year, and adds premiums for low‑carbon modules.
Israel Adds 900 MW Solar in 2024 – What It Means
Israel installed about 900 MW of new solar PV in 2024, most of it under merchant PPAs, marking a shift from tendered projects and moving the country toward its 30 % renewable‑energy goal.
Israel’s First Solar Hedging Projects Launch
Tralight has announced solar‑hedging pilots in Israel, employing PPAs and futures swaps to lock in revenue for PV farms and support the nation’s renewable‑energy goals.
Cheap Power Will Reach Only a Few – Why?
Russia’s new low‑price electricity regime will benefit only large industrial and nuclear customers because the state raised nuclear tariffs to offset falling wholesale prices.