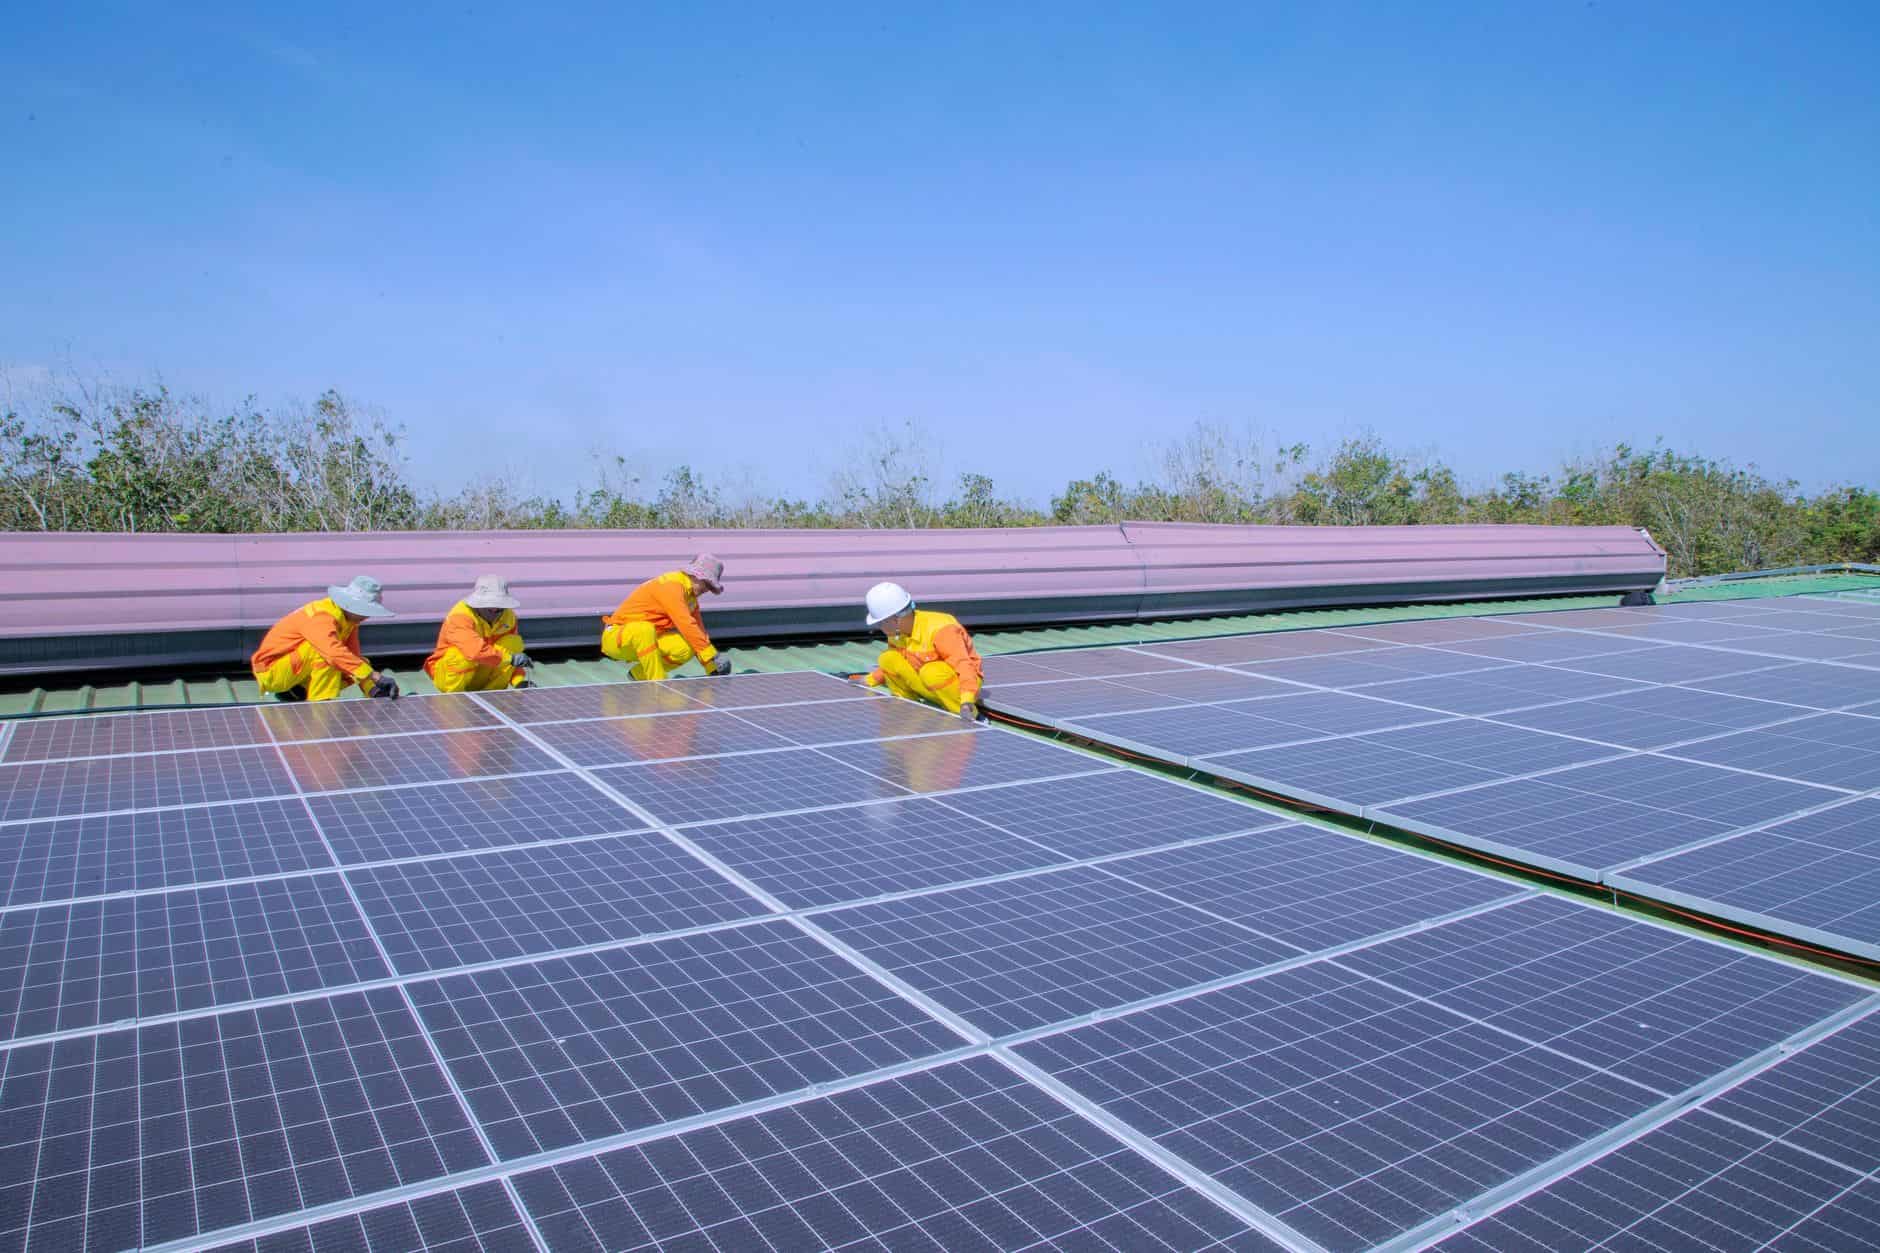
India's Solar Leap: From Imports to Exports
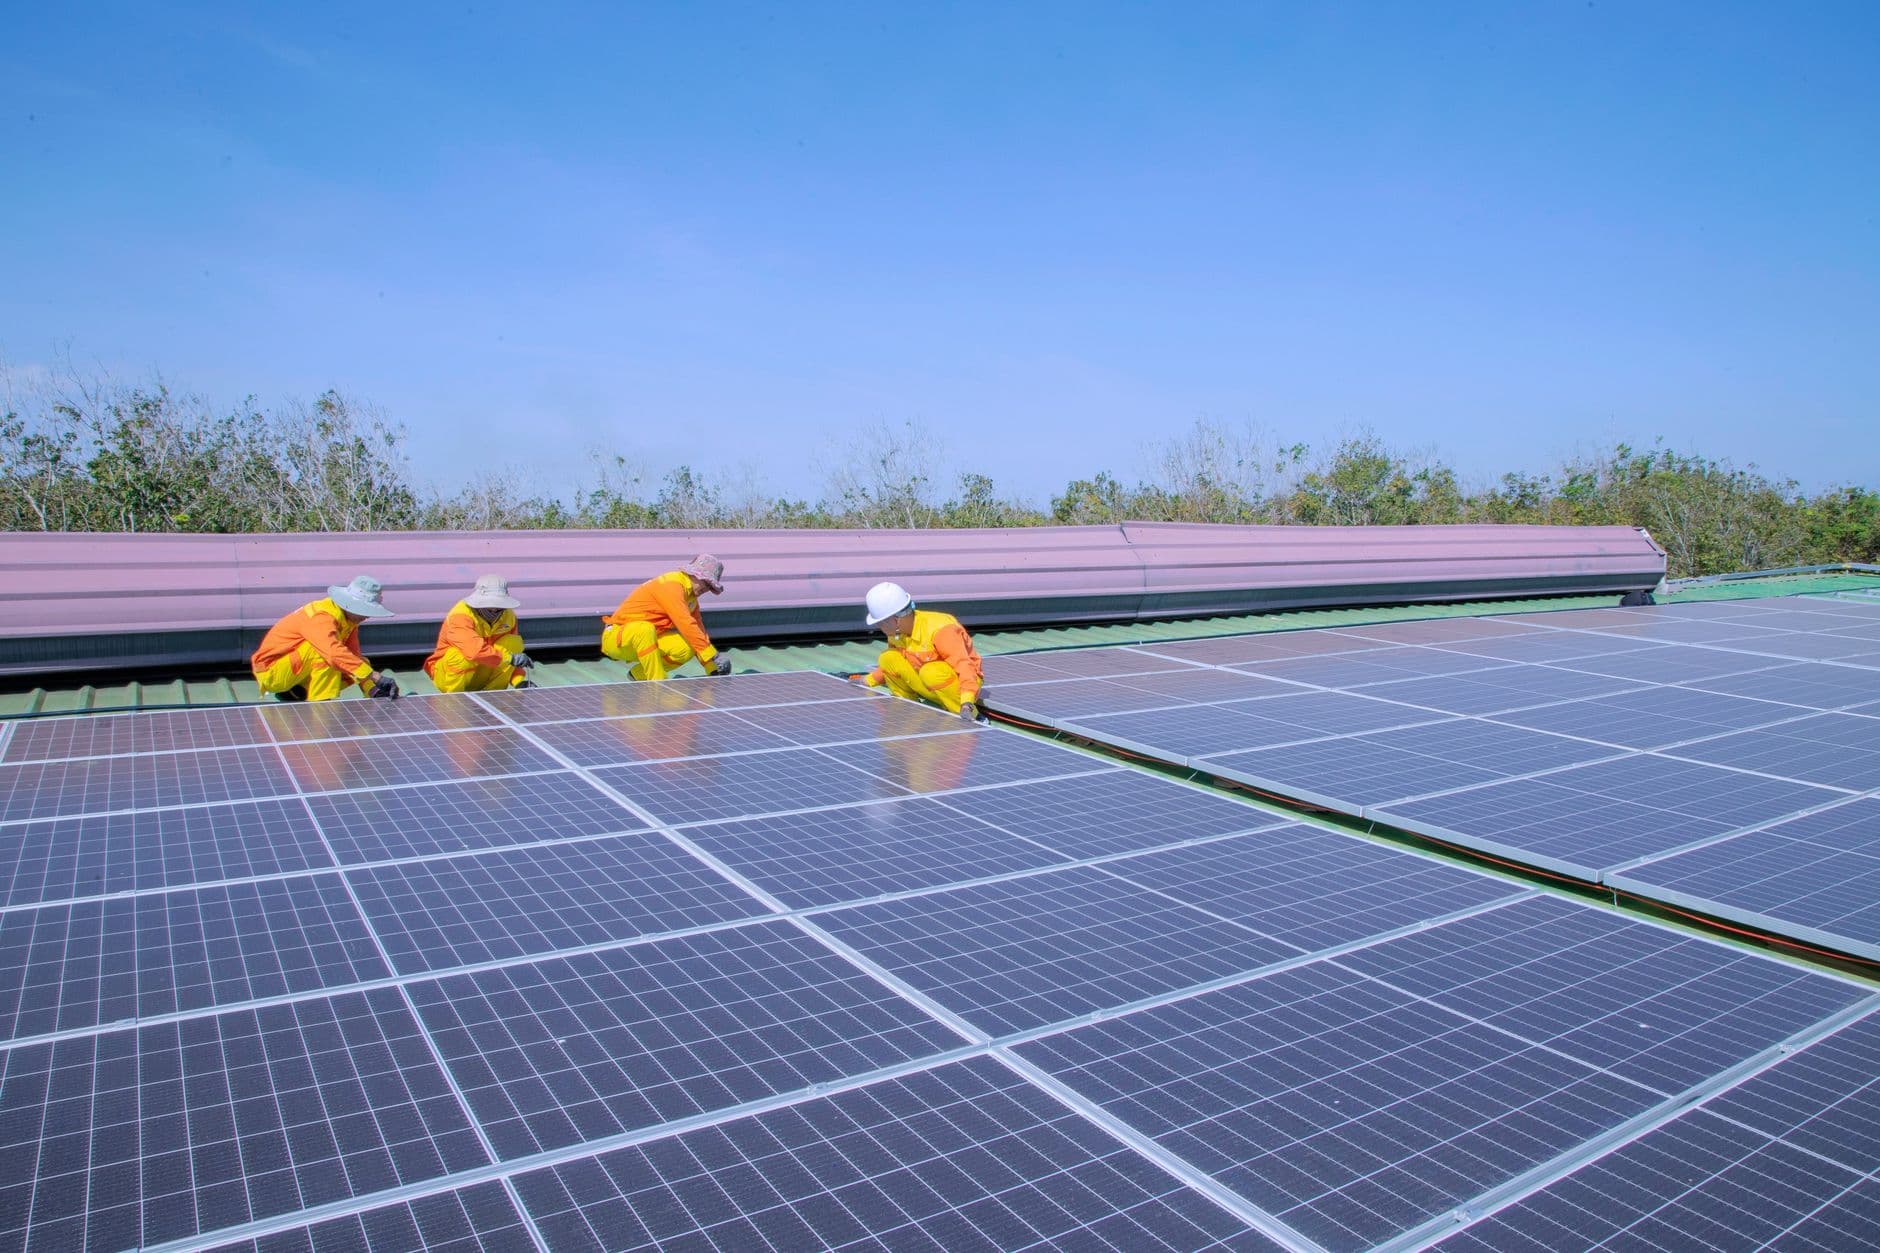
India’s Solar Manufacturing Turnaround – From a net importer to a net exporter in less than a decade
India has gone from relying on overseas cells, wafers and polysilicon to becoming one of the world’s fastest‑growing solar‑panel exporters. By mid‑2024 the country’s domestic cell capacity hit 7.6 GW and module capacity 77 GW, while FY 2024 PV‑module exports topped US$2 billion – a clear sign of global competitiveness.
Policy Tools That Drove the Shift – The Production‑Linked Incentive (PLI) and ALMM mandates reshaped the supply chain
The government’s Production‑Linked Incentive (PLI) scheme, launched in 2021, earmarks cash incentives for every megawatt of high‑efficiency cells and modules produced domestically. According to the Ministry of New and Renewable Energy, the PLI “aims to build an ecosystem for manufacturing of high‑efficiency solar cells and modules thus reduce import”. A separate Approved List of Models and Manufacturers (ALMM) order forces all government‑backed projects to source cells, ingots and wafers locally, progressively tightening the vertical integration requirement. Together, these policies moved the focus from simple assembly to full‑chain production.
Capacity Explosion and Export Surge – Numbers that prove the turnaround
- Cell capacity rose by 2 GW in the first half of 2024, taking total domestic capacity to 7.6 GW – a substantial increase.
- Module capacity now stands at 77 GW, enough to power a large number of homes.
- Exports of Indian PV modules reached US$2 billion in FY 2024, with shipments to Europe, Africa and the Middle East despite anti‑dumping duties in some markets.
- The export volume between April‑Nov FY 2024‑25 hit 782 million modules, underscoring the rapid scale‑up.
These figures show that the PLI‑driven capacity build‑up directly translated into market‑ready products and cash‑flowing exports.
Trade Barriers and New Market Strategies – How Indian firms turned tariffs into diversification
When anti‑dumping duties were introduced on Indian crystalline panels, Indian exporters did not retreat. Instead they re‑oriented sales toward emerging markets – such as Africa and the Middle East – while ramping up domestic sales to absorb the extra output. This dual‑track approach insulated the industry from any single market shock and kept the production lines running at high utilisation.
Gaps Still to Fill – Polysilicon, R&D and next‑generation cells remain the bottleneck
Even with massive cell and module capacity, India still imports most polysilicon and ingot‑crystallisation equipment. Industry analysts note that without domestic polysilicon processing the supply chain remains vulnerable to geopolitical swings. The next leap will require home‑grown R&D on next‑generation tandem and perovskite cells, rather than relying solely on foreign technology licences. The government has expressed interest in supporting such research, but substantial private investment will also be needed.
What It Means for Israel – Lessons for our own solar‑industry roadmap
India’s policy mix shows how targeted incentives + mandatory local‑content rules can fast‑track a domestic supply chain. Israel already enjoys a high solar‑irradiance environment and a 30 % renewable‑energy target for 2030. Applying a similar incentive model could shrink our reliance on imported cells and boost local manufacturing.
Illustrative Israeli ROI: A typical 10 kWp rooftop system in central Israel yields ≈17 000 kWh / yr (1 700 kWh per kWp). At the residential tariff ₪0.48 /kWh, that electricity is worth ₪8 160 / yr. With a turnkey cost of ₪3 150 /kWp, the upfront spend is ₪31 500 – giving a simple payback of about 3.9 years (31 500 ÷ 8 160) and a 25‑year lifetime thereafter. This calculation uses the verified Israeli figures and shows that, even without subsidies, rooftop solar is financially attractive. A national PLI‑style programme for solar‑cell and wafer production could further lower those costs, create jobs, and help Israel meet its 2030 target while reducing exposure to global supply shocks.
Outlook – From today’s export surge to tomorrow’s advanced‑cell hub
If India can close the polysilicon gap and fund home‑grown R&D, it could aim to become a leading global solar‑module exporter. For countries like Israel, the Indian experience offers a blueprint: combine financial incentives, enforce local‑content mandates, and nurture upstream R&D to build a resilient, export‑ready solar industry.
*For readers wanting to crunch their own numbers, try our solar ROI calculator and explore the latest market data on solar manufacturing trends.*
Sources & further reading
- Production Linked Incentive (PLI) Scheme: National Programme on...
- Assessing the effectiveness of India's solar Production Linked...
- PLI Scheme | Solar Energy Corporation of India Limited (SECI)
- PLI Scheme for High Efficiency Solar PV Modules - NSWS
- Production Linked Incentive Scheme, 2020: Transforming India's...
FAQ
How much solar‑cell capacity did India add in 2024?
India added about 2 GW of solar‑cell capacity in the first half of 2024, bringing total domestic capacity to 7.6 GW.
What is the Production‑Linked Incentive (PLI) scheme?
The PLI scheme gives cash incentives for every megawatt of high‑efficiency cells and modules produced in India, aiming to create a full‑chain manufacturing ecosystem.
How much did Indian PV‑module exports earn in FY 2024?
Exports of Indian photovoltaic modules reached roughly US$2 billion in fiscal year 2024.
Why does India still import polysilicon?
Domestic polysilicon processing capacity is limited, so most raw silicon and ingot‑crystallisation equipment are still sourced abroad.
What can Israel learn from India’s solar policy?
Israel could adopt targeted incentives and local‑content mandates to develop its own cell and wafer industry, lowering rooftop‑system costs and creating jobs.
What is a typical payback period for a 10 kWp home system in Israel?
At a residential tariff of ₪0.48/kWh and a cost of ₪3 150/kWp, the payback is about 3.9 years.
Share this post
More from Markets
6
Solar, Batteries Defy Global Shock Costs
GenCost shows solar PV and battery costs keep falling despite global crises, driving Australian wholesale prices from a peak of AU$189/MWh down to AU$60‑80/MWh, while gas turbines and wind face rising costs.
South Korea’s 1 GW Solar Tender Hits Record Low
South Korea’s new 1 GW solar tender caps bids at KRW 147,686/kWh (≈ $99.46 /MWh), a 5 % drop from last year, and adds premiums for low‑carbon modules.
Israel Adds 900 MW Solar in 2024 – What It Means
Israel installed about 900 MW of new solar PV in 2024, most of it under merchant PPAs, marking a shift from tendered projects and moving the country toward its 30 % renewable‑energy goal.
Israel’s First Solar Hedging Projects Launch
Tralight has announced solar‑hedging pilots in Israel, employing PPAs and futures swaps to lock in revenue for PV farms and support the nation’s renewable‑energy goals.
Cheap Power Will Reach Only a Few – Why?
Russia’s new low‑price electricity regime will benefit only large industrial and nuclear customers because the state raised nuclear tariffs to offset falling wholesale prices.
AI Data Centers Spark Solar Boom in Israel
Israeli renewable firms are targeting the AI data‑center boom, leveraging a solar market that’s growing at over 30 % CAGR to power next‑generation compute hubs.