US Solar Module Prices Hold at $0.30/W
Prices stay flat at $0.30/W — the headline number explained
The median price for U.S.-assembled photovoltaic modules was exactly $0.30 per watt in Q2 2026, according to data from supply‑chain platform Anza. The inter‑quartile range was $0.280‑$0.325/W, and after a brief dip of $0.015/W between March and April, the price rebounded by $0.005/W in May and then held steady through June and early July. This stability is unusual in a market that has seen rapid price swings over the past decade.
FEOC rules and Chinese divestitures keep the market from dropping further
The price floor is largely a product of the Foreign Entity of Concern (FEOC) framework introduced by the “One Big Beautiful Bill” (OBBB) in July 2025. Projects that use components owned by a Prohibited Foreign Entity (more than 25 % equity or 15 % debt, or a combined 40 % threshold) lose eligibility for the Investment Tax Credit (ITC). To stay ITC‑eligible, Chinese‑owned manufacturers with U.S. factories sold those assets: Trina Solar’s Texas plant went to FREYR Battery, JA Solar’s Arizona megafactory was bought by Corning (via American Panel Solutions), JinkoSolar trimmed its stake in Florida to 24.9 %, and Longi reduced its share in Ohio’s Illuminate USA joint venture. Anza notes that most of the original Chinese owners still supply cells or hold brand licences, creating a “fundamental paradox” where Chinese supply chains dominate even after the divestitures — a point echoed by Wood Mackenzie.
New AD/CVD petition adds a layer of tariff risk for South Korean makers
On 18 June 2026 a coalition called American Manufacturers for Energy Resilience (AMER) filed an anti‑dumping and countervailing‑duty petition against South Korean c‑Si cell and module producers. The petition targets Hanwha Q Cells, HD Hyundai Energy Solutions and Shinsung E&G, accusing them of using Chinese polysilicon and wafers while claiming a “minor” processing role. If the Department of Commerce imposes duties, buyers could see additional costs as early as September 2026 for countervailing duties and November 2026‑January 2027 for anti‑dumping duties. Reuters reported the filing and the potential timeline.
TOPCon technology dominates the U.S.‑assembled segment
Anza’s module snapshot shows that 49 of the 55 tracked modules (≈ 89 %) use Tunnel Oxide Passivated Contact (TOPCon) cells, while only six rely on the older Mono‑PERC design. All 45 Tier‑1‑qualified modules are FEOC‑compliant, and 32 already meet the stricter 45 % FEOC‑content threshold that will apply to projects starting 1 January 2027. The supply chain remains globally diverse: polysilicon comes from Malaysia (24 modules), the United States (15) and China (13); cells are sourced from ten countries, with Kenya and the Philippines providing the largest shares.
What it means for Israel
At a $0.30/W module price, a 1 kW of panels costs about $300. In Israel, the typical turnkey cost is ₪3,150 per kW (about $900 at prevailing exchange rates), roughly three times the U.S. panel price before other costs are added. Using the typical Israeli residential feed‑in tariff of ₪0.48 /kWh, a representative 10 kW home system in central Israel would generate about 17,000 kWh per year, worth roughly ₪8,160 annually, and the simple payback is around 3.9 years (based on the illustrative Israeli case). This illustrates a cost gap between U.S. module pricing and Israeli turnkey costs. Israeli investors should keep an eye on U.S. policy developments such as FEOC thresholds and potential polysilicon tariffs, as they may eventually influence local pricing. Tools like our solar ROI calculator and market data page can help model any future U.S. price changes on Israeli project economics.
Key take‑aways
- Median U.S.‑assembled module price: $0.30/W (Q2 2026).
- FEOC compliance now a prerequisite for ITC eligibility; Chinese owners have divested U.S. plants to stay below ownership thresholds.
- A new AD/CVD petition threatens South Korean exporters with duties as early as September 2026.
- TOPCon cells dominate (≈ 89 % of tracked modules).
- Compared with Israel’s typical panel cost of ₪3,150/kW, U.S. module prices are roughly ⅓ of the Israeli turnkey price, underscoring a significant regional cost disparity.
FAQ
Why haven't U.S. solar module prices dropped further?
The FEOC framework forces Chinese‑linked factories to divest, limiting cheap supply, while a new AD/CVD petition could add duties on Korean imports, both keeping prices flat.
What is the FEOC threshold and how does it affect projects?
Projects using components where a foreign entity holds >25 % equity or >15 % debt lose ITC eligibility; the threshold will rise to 45 % for projects starting Jan 2027.
Which technology now dominates U.S.‑assembled modules?
Tunnel Oxide Passivated Contact (TOPCon) cells, used in about 89 % of the 55 modules tracked by Anza.
When could South Korean manufacturers face new duties?
If the petition proceeds, countervailing duties may start in September 2026 and anti‑dumping duties could be announced between November 2026 and January 2027.
How does the $0.30/W price compare to Israeli solar costs?
A 15 kW system costs $4,500 for panels in the U.S. versus roughly ₪47,250 (≈ $13,500) in Israel, meaning Israeli panel costs are about three times higher.
Share this post
More from Markets
6
Zambia's Solar Boom: New Deals Power the Future
Zambia is rapidly becoming Africa’s most attractive solar market thanks to new procurement mechanisms, a Norway‑backed carbon‑finance facility, and open‑access rules that de‑risk large‑scale solar‑plus‑storage projects.
Australia June Solar Install Drop Still Record
Australia installed 322 MW of rooftop solar in June 2026 – a 4 % dip month‑on‑month but still the strongest June on record, adding about 0.7 % to the nation’s total PV stock.
France’s C&I Rooftop Solar Hits Record Low Price
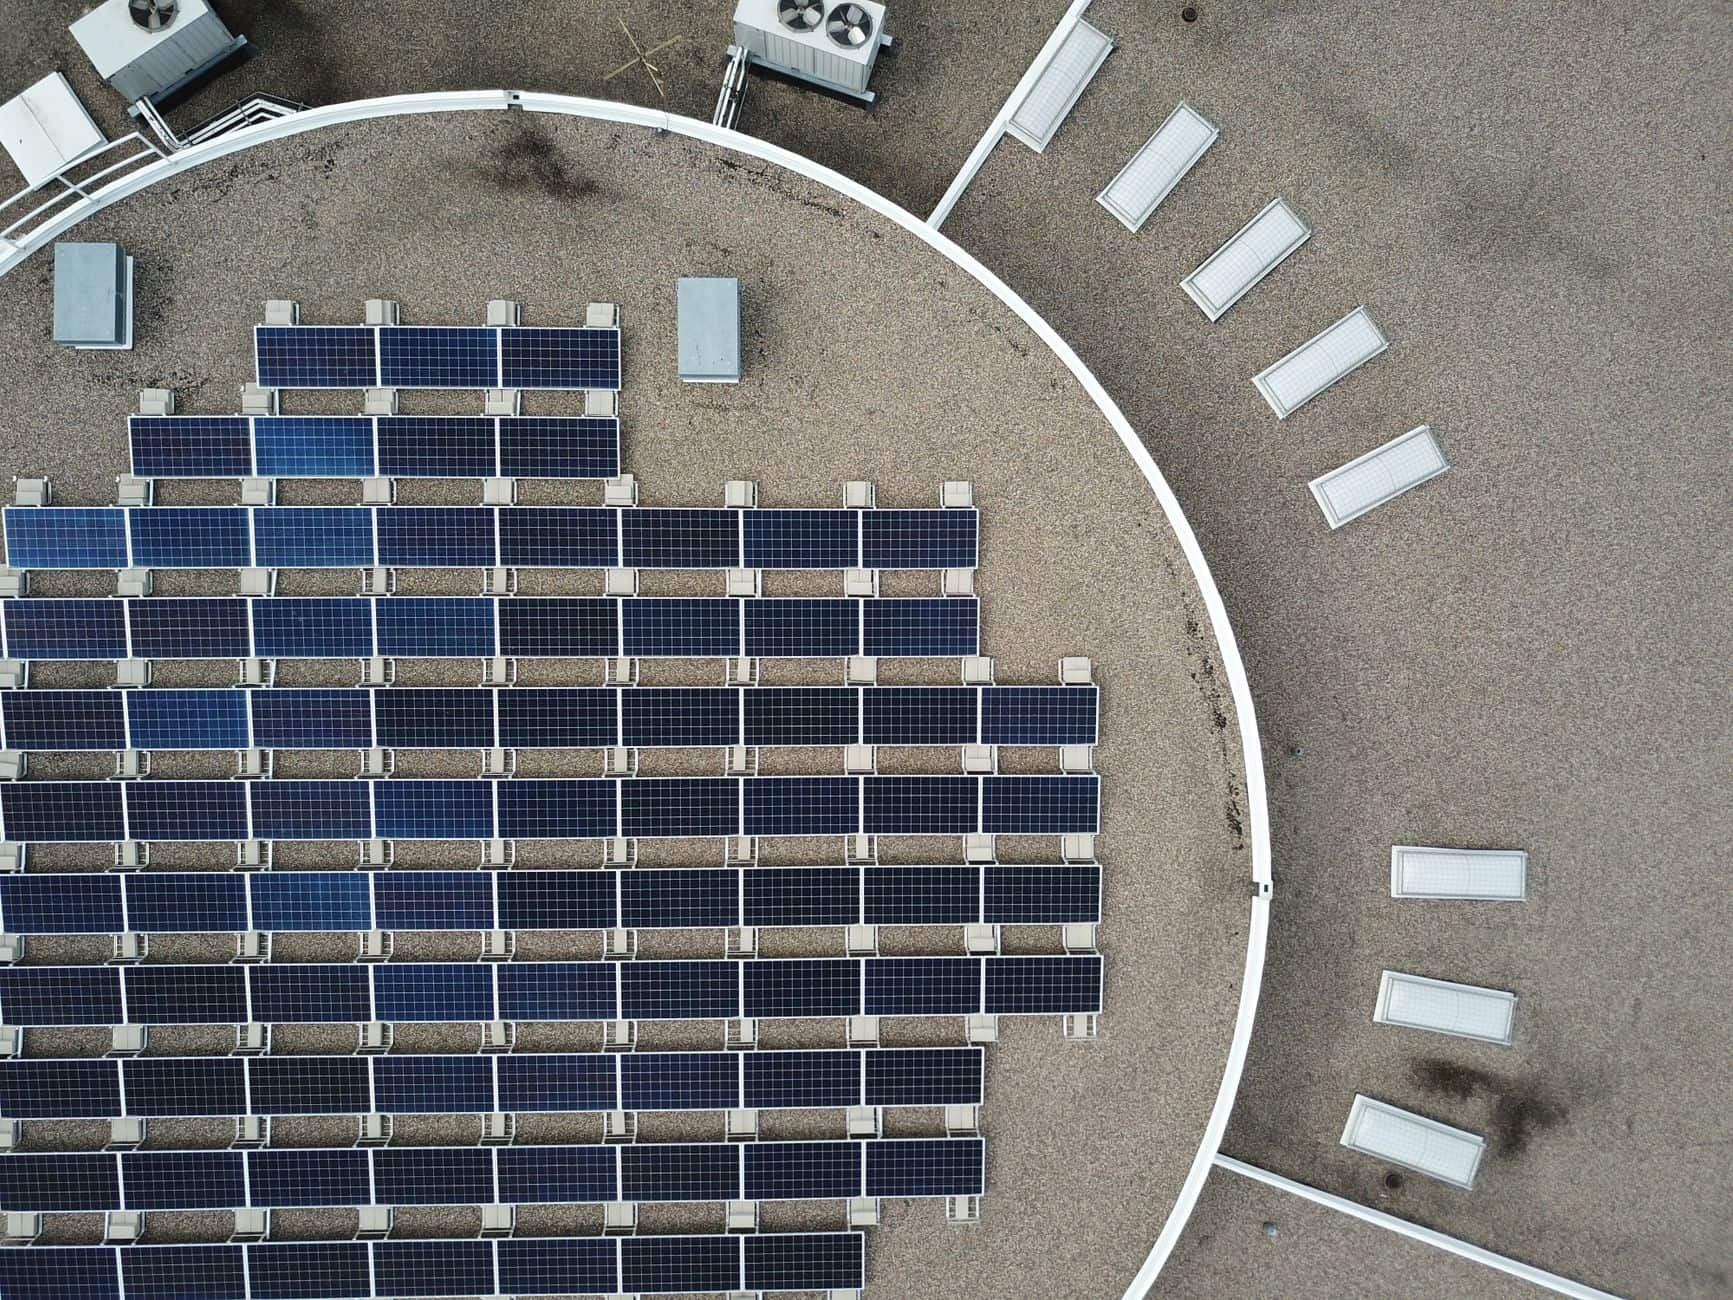
France awarded 300 MW of C&I rooftop solar at a record‑low €0.082/kWh, with demand five times the supply and rooftop projects making up 62 % of the allocation.
Israel’s Solar Boom: 30% CAGR to 2032
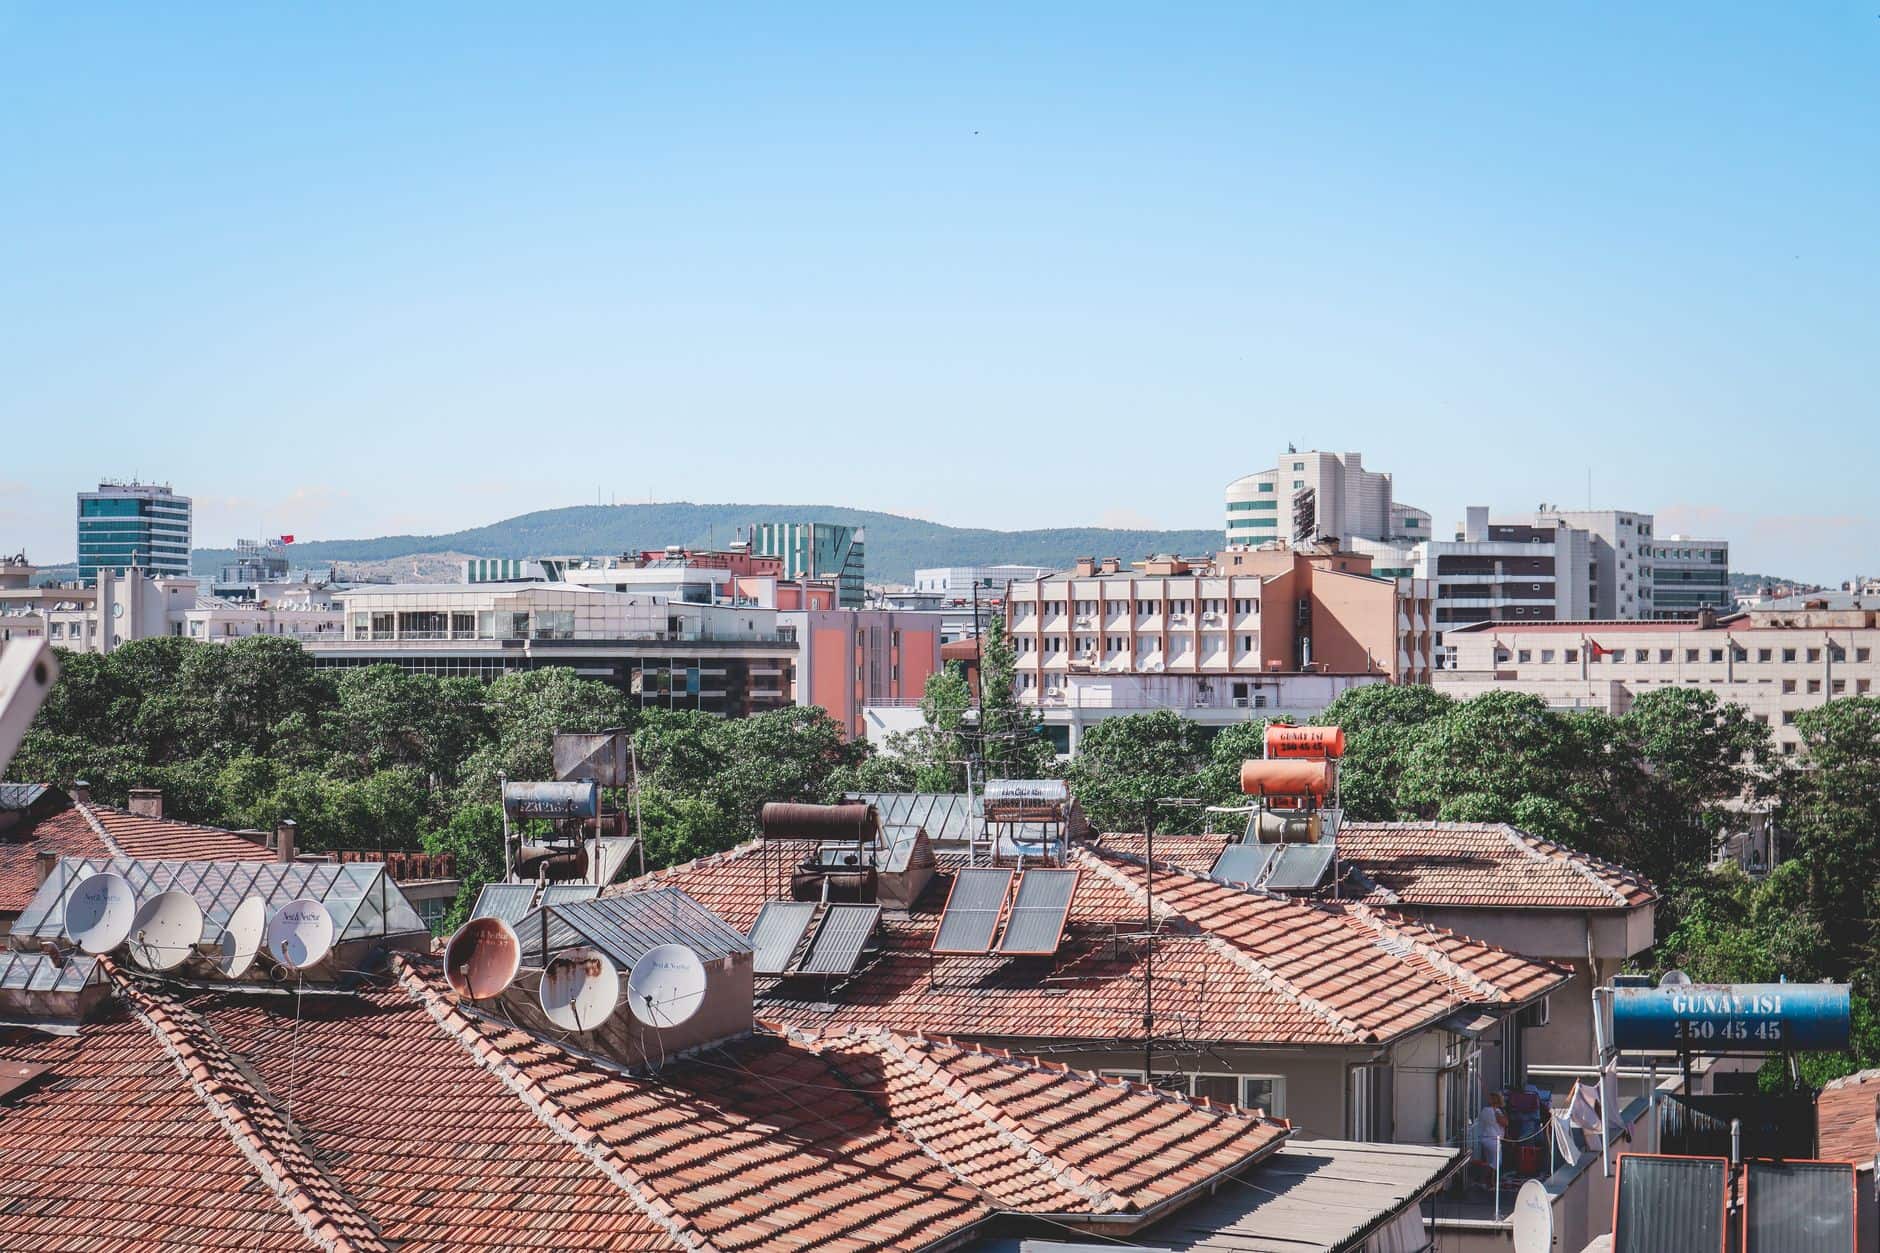
Israel’s solar market is projected to jump from US$187 million in 2024 to US$1.63 billion by 2032, a 31 % CAGR, driven by a 1.3 GW project pipeline and new tariff incentives.
India’s New Renewables Face 33% Curtailment
About a third of India’s newly commissioned renewable capacity is being curtailed, with 50‑60% solar curtailment during peak hours, due to transmission delays.
Algeria’s Race to 15 GW Solar by 2035
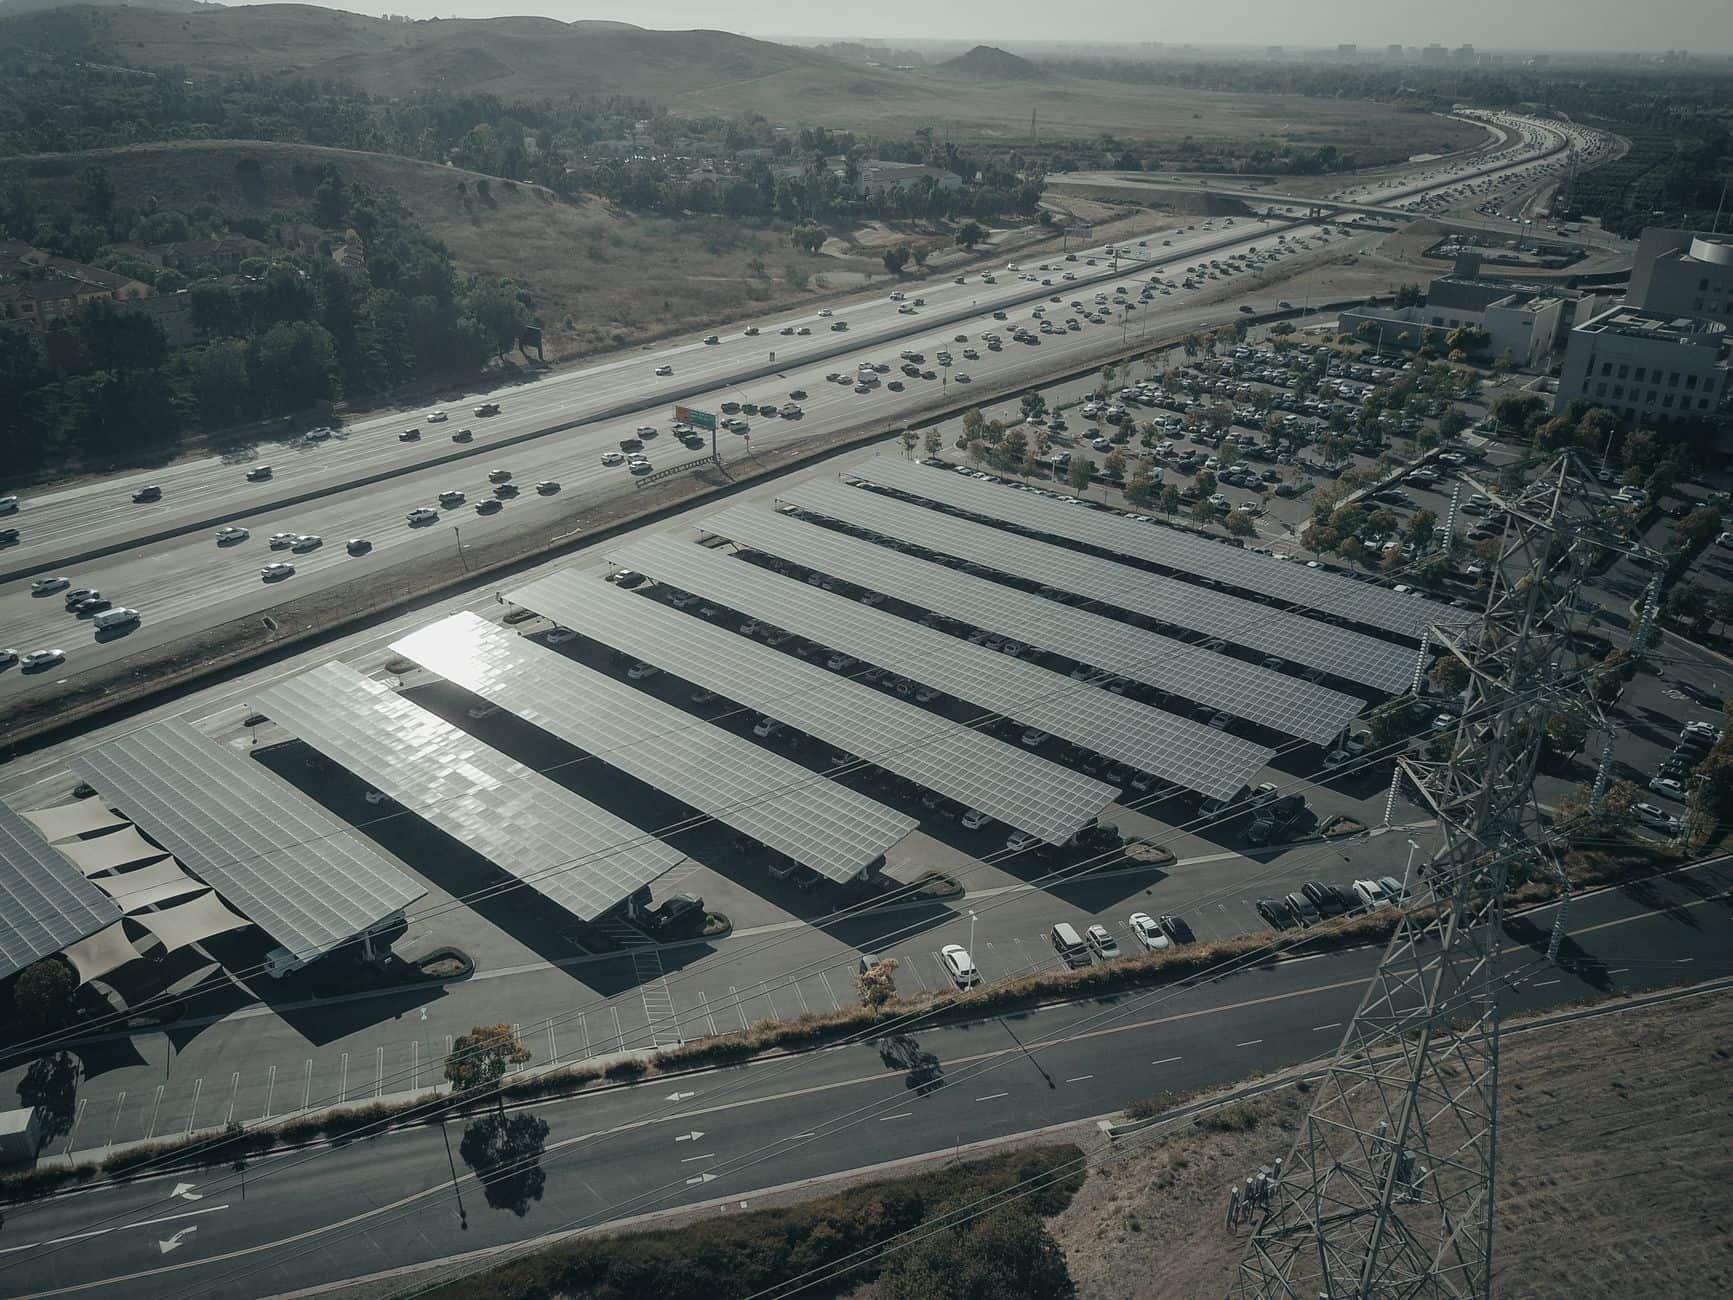
Algeria has set a 15 GW solar target for 2035 and is already moving a 3.2 GW pipeline forward, but achieving it will require private‑sector financing, clear PPAs and a shift to an IPP model.