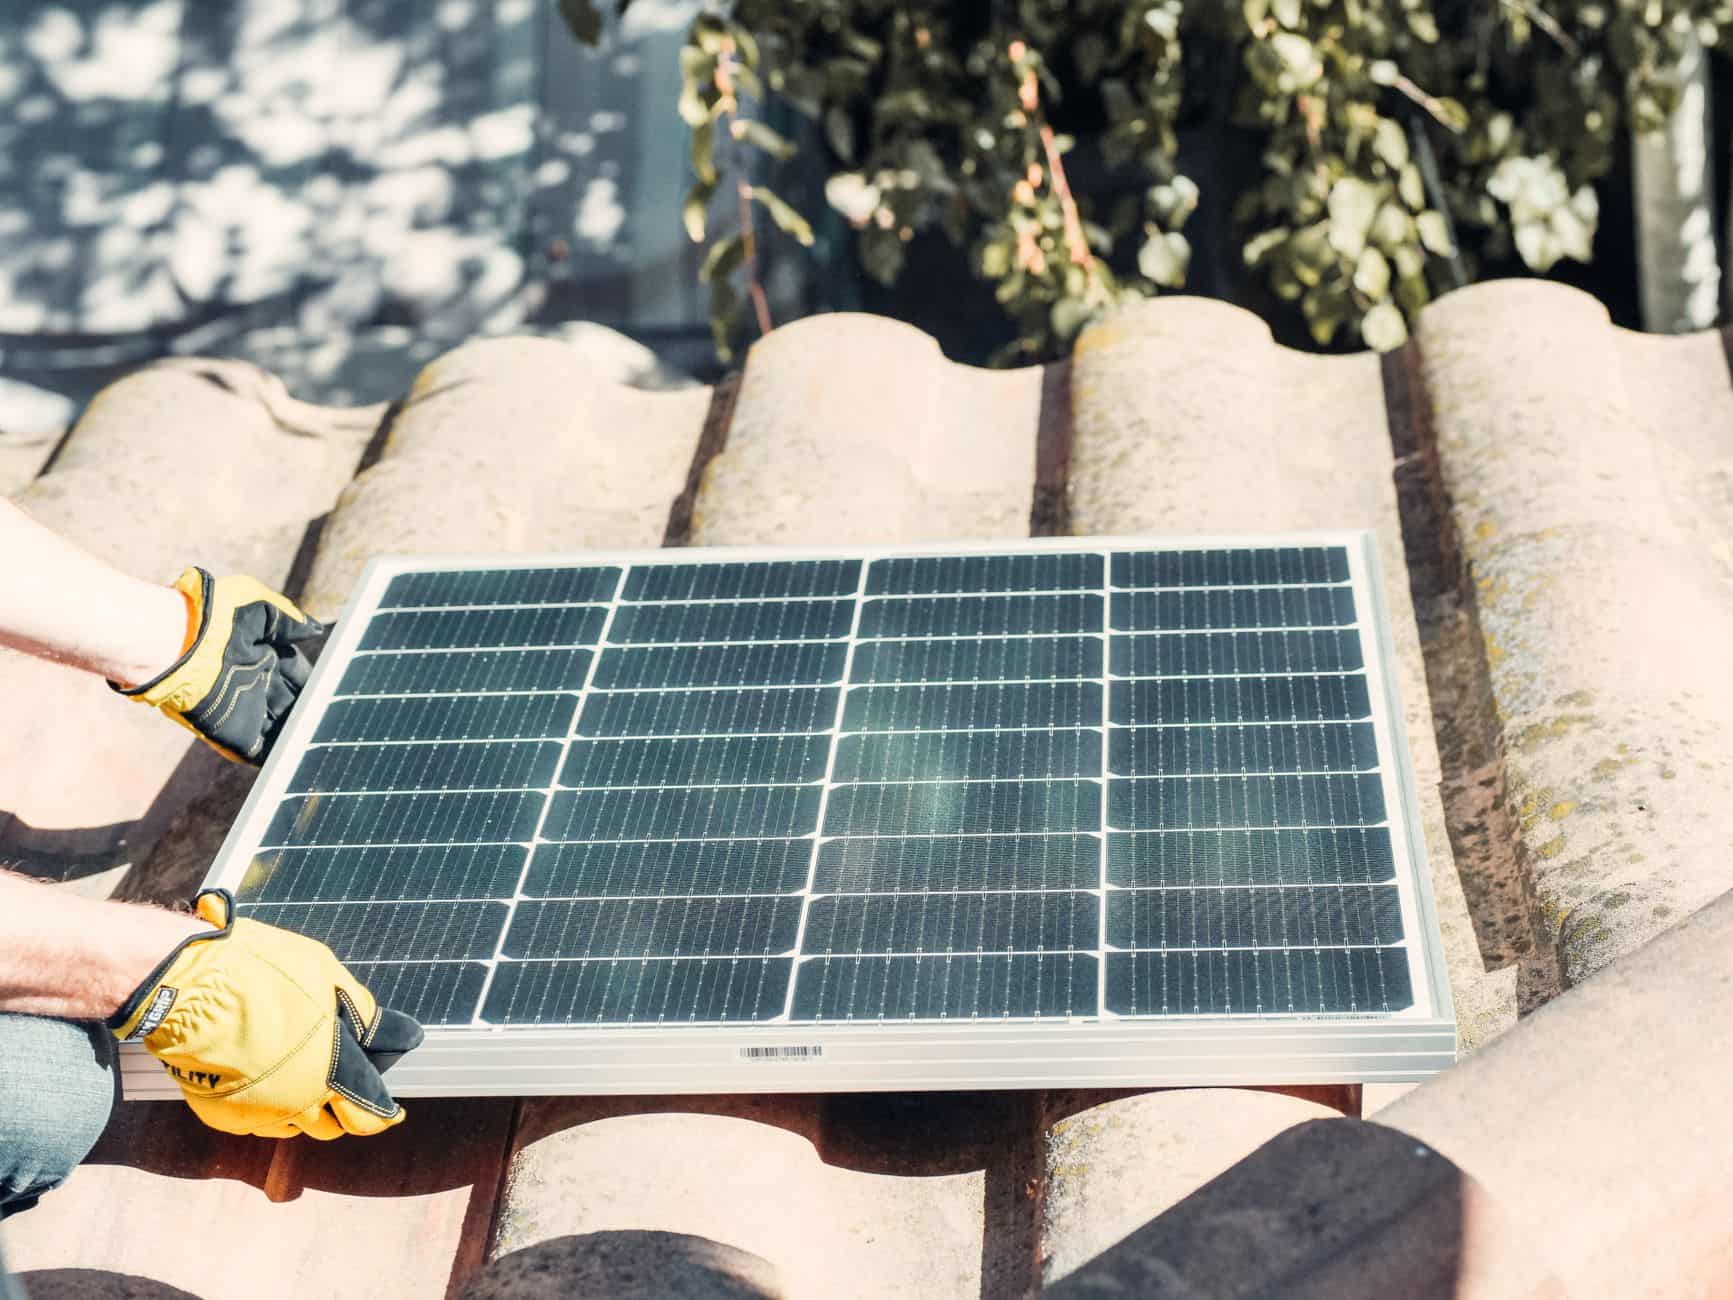
Australia June Solar Install Drop Still Record
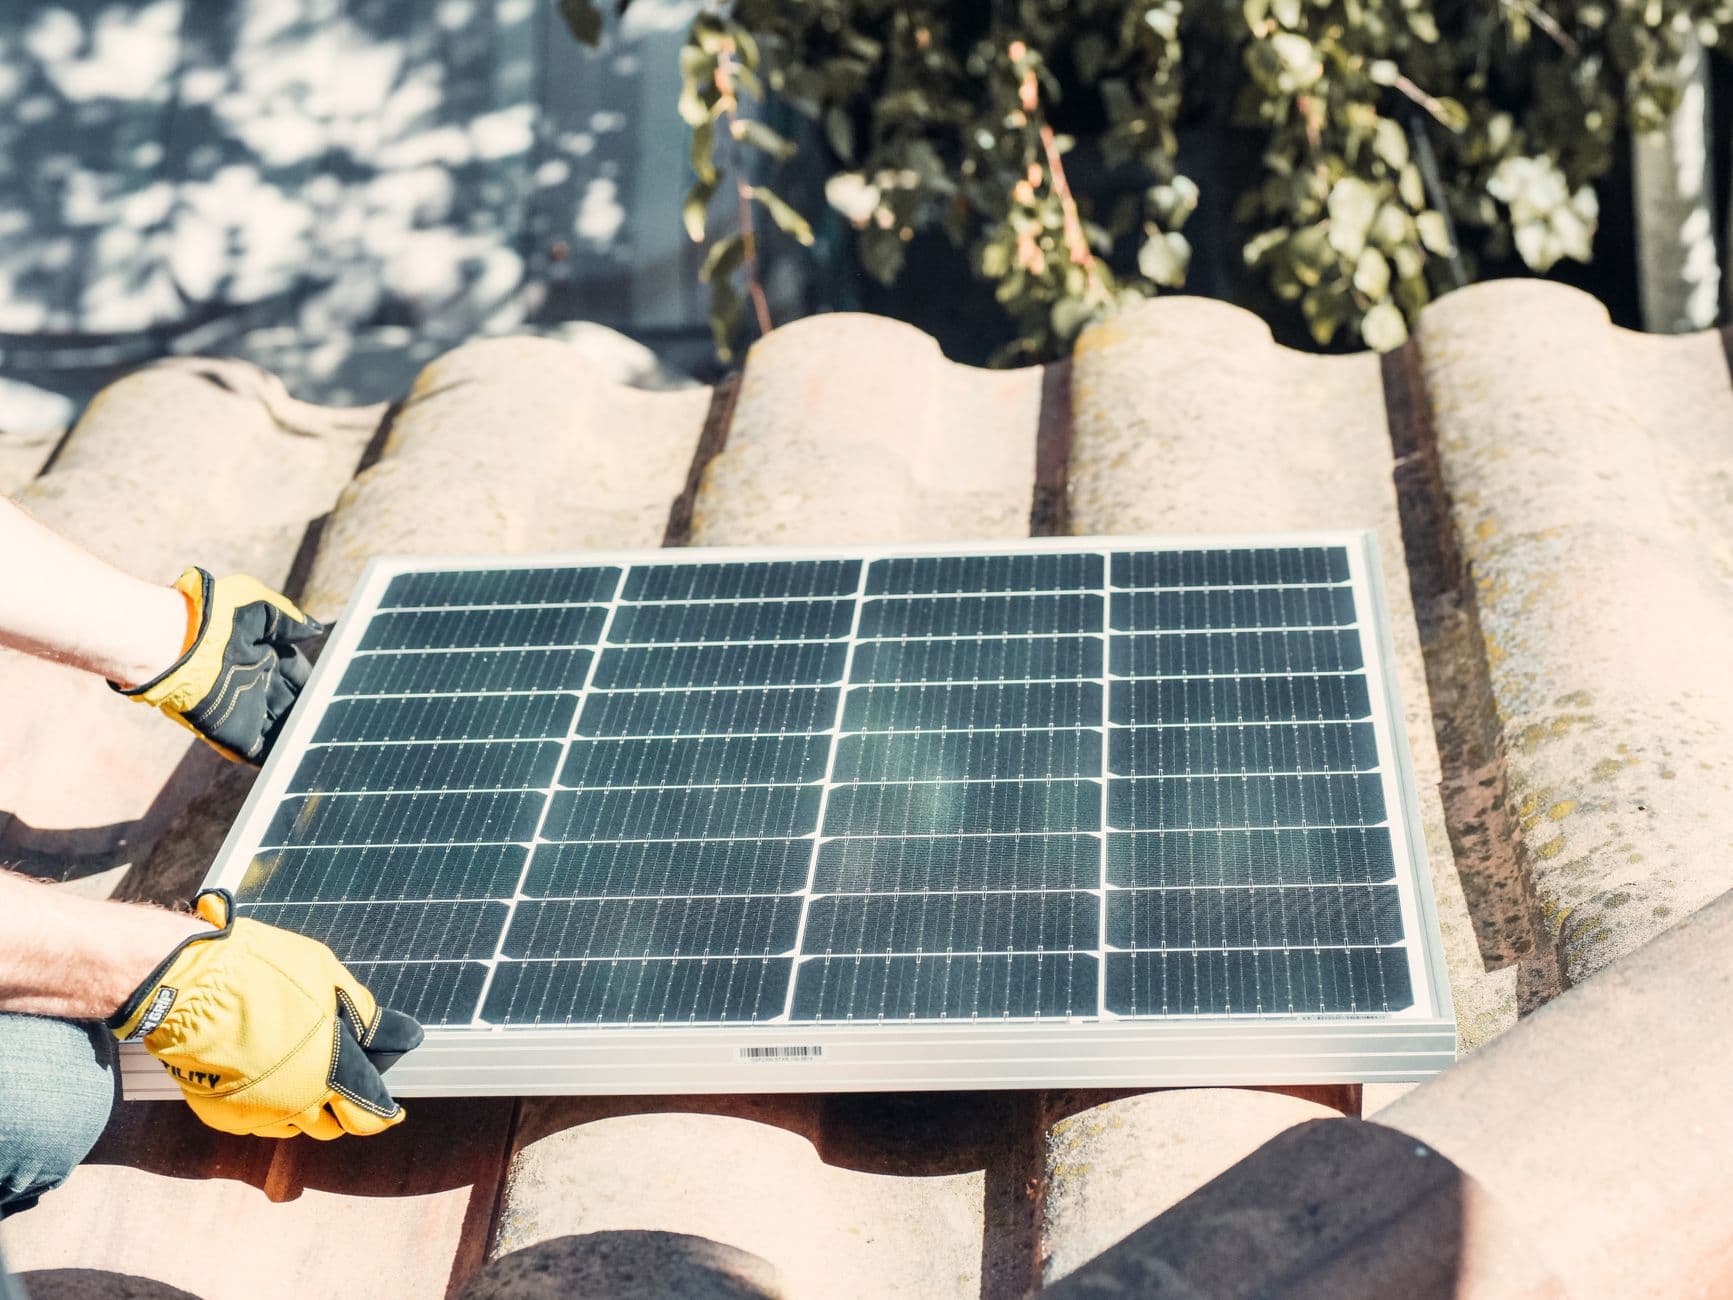
June 2026 saw 322 MW of new rooftop solar installed – a 4% month‑on‑month dip but still the strongest June on record
Australia added 322 MW of small‑scale photovoltaic (PV) capacity in June 2026, according to SunWiz data. That figure is 4 % lower than May and 26 % below April’s all‑time record of 435 MW, yet it remains the highest June‑month total ever recorded and puts the January‑June cumulative installs about 41 % ahead of the same period in 2025.
10‑15 kW systems dominate the market, making up 37 % of new capacity
The 10‑15 kW segment led the market with 118 MW (≈37 % of total June installs) and grew 2 % month‑on‑month, driven mainly by New South Wales and Queensland. By contrast, the 20‑30 kW and 15‑20 kW brackets fell 31 % and 16 % respectively, dragging down the overall average system size to a 12‑month low of 10.01 kW.
Queensland is the only state with growth, up 16 % MoM
State‑by‑state, Queensland posted a 16 % month‑on‑month increase in STC registrations, while all other jurisdictions slipped: ACT ‑1 %, NSW ‑3 %, WA ‑5 %, NT ‑9 %, Tasmania ‑11 %, and both Victoria and South Australia down 9 % each.
The dip is linked to the Cheaper Home Batteries Program rebate cut
SunWiz attributes the June slowdown to a sharp fall in battery demand after the federal government reduced the incentives of its Cheaper Home Batteries Program on 1 May. The rebate, which offers roughly a 30 % discount on small‑scale battery installations, had spurred a surge in combined solar‑plus‑storage projects in the preceding months.
June’s 322 MW still adds about 0.7 % to Australia’s total rooftop PV stock
Australia’s cumulative rooftop PV capacity stood at roughly 45.1 GW by the end of 2025. The 322 MW installed in June therefore represents about 0.7 % of the nation’s total rooftop solar base – a meaningful boost in a single month.
What it means for Israel: translating Australian momentum to local savings
Even though the Australian market is much larger, the dynamics are relevant for Israeli homeowners. Using typical Israeli figures (residential tariff ≈ ₪0.48/kWh, install cost ≈ ₪3,150/kWp, average yield in the central region ≈ 1,700 kWh/kWp / yr), a 10 kW home system would generate ~17,000 kWh annually, worth about ₪8,160 per year. At a cost of ₪31,500, the simple payback is roughly 3.9 years, after which the system continues to produce clean energy for the remainder of its 25‑year life. If similar growth rates were achieved in Israel, it could significantly accelerate progress toward the nation’s 30 % renewable electricity target for 2030.
Outlook: steady growth despite short‑term dips
SunWiz stresses that the June dip is a “maturing normalization, not a reversal”. With battery incentives stabilising and the 10‑15 kW segment proving resilient, the Australian rooftop solar market is poised to keep expanding, feeding into the broader global surge where solar PV capacity is expected to double by 2030.
What it means for Israel
- A typical 10 kW Israeli home system yields ~17 MWh/yr → ≈ ₪8,160 in savings.
- Installation cost ≈ ₪31,500 → payback ≈ 3.9 years.
- Replicating strong growth could help meet the 30 % 2030 renewable target.
For deeper analysis, try our solar ROI calculator or explore the latest market data on our data page.
Sources & further reading
FAQ
Why did Australian rooftop solar installations fall in June 2026?
The drop is linked to the government’s reduction of the Cheaper Home Batteries Program rebate on 1 May, which slowed demand for combined solar‑plus‑storage systems.
What was the total new solar capacity added in June 2026?
SunWiz reported 322 MW of small‑scale PV capacity was registered in June 2026.
Which system size segment grew the most in June?
The 10‑15 kW segment, accounting for 118 MW (≈37 % of June installs), rose 2 % month‑on‑month.
How does June’s install figure compare to Australia’s total rooftop solar stock?
June’s 322 MW adds about 0.7 % to the nation’s roughly 45.1 GW of rooftop PV capacity recorded at the end of 2025.
What can Israeli homeowners learn from Australia’s solar trends?
Even modest monthly growth can accelerate renewable targets; a typical 10 kW Israeli system pays back in under 4 years and continues saving for decades.
Share this post
More from Markets
6
Zambia's Solar Boom: New Deals Power the Future
Zambia is rapidly becoming Africa’s most attractive solar market thanks to new procurement mechanisms, a Norway‑backed carbon‑finance facility, and open‑access rules that de‑risk large‑scale solar‑plus‑storage projects.
France’s C&I Rooftop Solar Hits Record Low Price
France awarded 300 MW of C&I rooftop solar at a record‑low €0.082/kWh, with demand five times the supply and rooftop projects making up 62 % of the allocation.
Israel’s Solar Boom: 30% CAGR to 2032
Israel’s solar market is projected to jump from US$187 million in 2024 to US$1.63 billion by 2032, a 31 % CAGR, driven by a 1.3 GW project pipeline and new tariff incentives.
India’s New Renewables Face 33% Curtailment
About a third of India’s newly commissioned renewable capacity is being curtailed, with 50‑60% solar curtailment during peak hours, due to transmission delays.
Algeria’s Race to 15 GW Solar by 2035
Algeria has set a 15 GW solar target for 2035 and is already moving a 3.2 GW pipeline forward, but achieving it will require private‑sector financing, clear PPAs and a shift to an IPP model.
Europe’s Rooftop Solar Is Going Unmaintained
Europe’s 65 GW of new solar in 2025 left millions of rooftop systems without a maintenance provider after installer bankruptcies, creating a growing pool of orphaned PV assets.