
EU Solar Hits Record 58.8 TWh in Q1 2026
EU Renewable Share Soars to 45.5% in Q1 2026
Renewables supplied 45.5 % of the electricity generated across the European Union in the first quarter of 2026, up from 42.7 % a year earlier. The jump reflects a strong performance by wind (44.9 % of renewable output) and a growing contribution from solar, which produced 58.8 TWh – enough to power roughly 13 million European homes.
The EU’s total net electricity generation in Q1 2026 reached 746.6 TWh, a modest rise over the 718.3 TWh recorded in the same period of 2025. The higher renewable share therefore stems from both increased generation and a slight dip in fossil‑fuel output, according to Eurostat’s latest energy balance.
Solar’s Share Climbs to 17.3% of EU Renewables
Solar accounted for 17.3 % of the renewable electricity mix in Q1 2026, making it the third‑largest renewable source after wind and hydro. The sector generated 58.8 TWh, up from 55.3 TWh in Q1 2025. Monthly breakdown shows a steady rise: 10.8 TWh in January, 15 TWh in February, and a record 33 TWh in March.
These figures match the trend reported by Ember, which noted a record‑high 369 TWh of solar generation across the EU in 2025 – a 13 % share of total EU electricity and the first time solar and wind together out‑produced fossil fuels.
Country‑by‑Country Highlights
Among EU members, Denmark led the pack with 90 % of its electricity coming from renewables, driven largely by wind. Portugal followed at 82.9 %, thanks to abundant hydro resources, while Lithuania posted 75 %, again dominated by wind.
At the opposite end, Slovakia (17.2 %), Malta (13 %), and Czechia (12.7 %) recorded the lowest renewable shares in Q1 2026. The disparity underscores how policy, grid capacity, and natural resources shape each country’s clean‑energy trajectory.
Why the Surge Matters
The EU’s renewable surge aligns with the 2023 revision of the Renewable Energy Directive, which raised the 2030 binding target to at least 42.5 % (up from 32 %). The 45.5 % share in Q1 2026 already exceeds that goal, suggesting the bloc is on track to meet – and possibly surpass – its 2030 ambition.
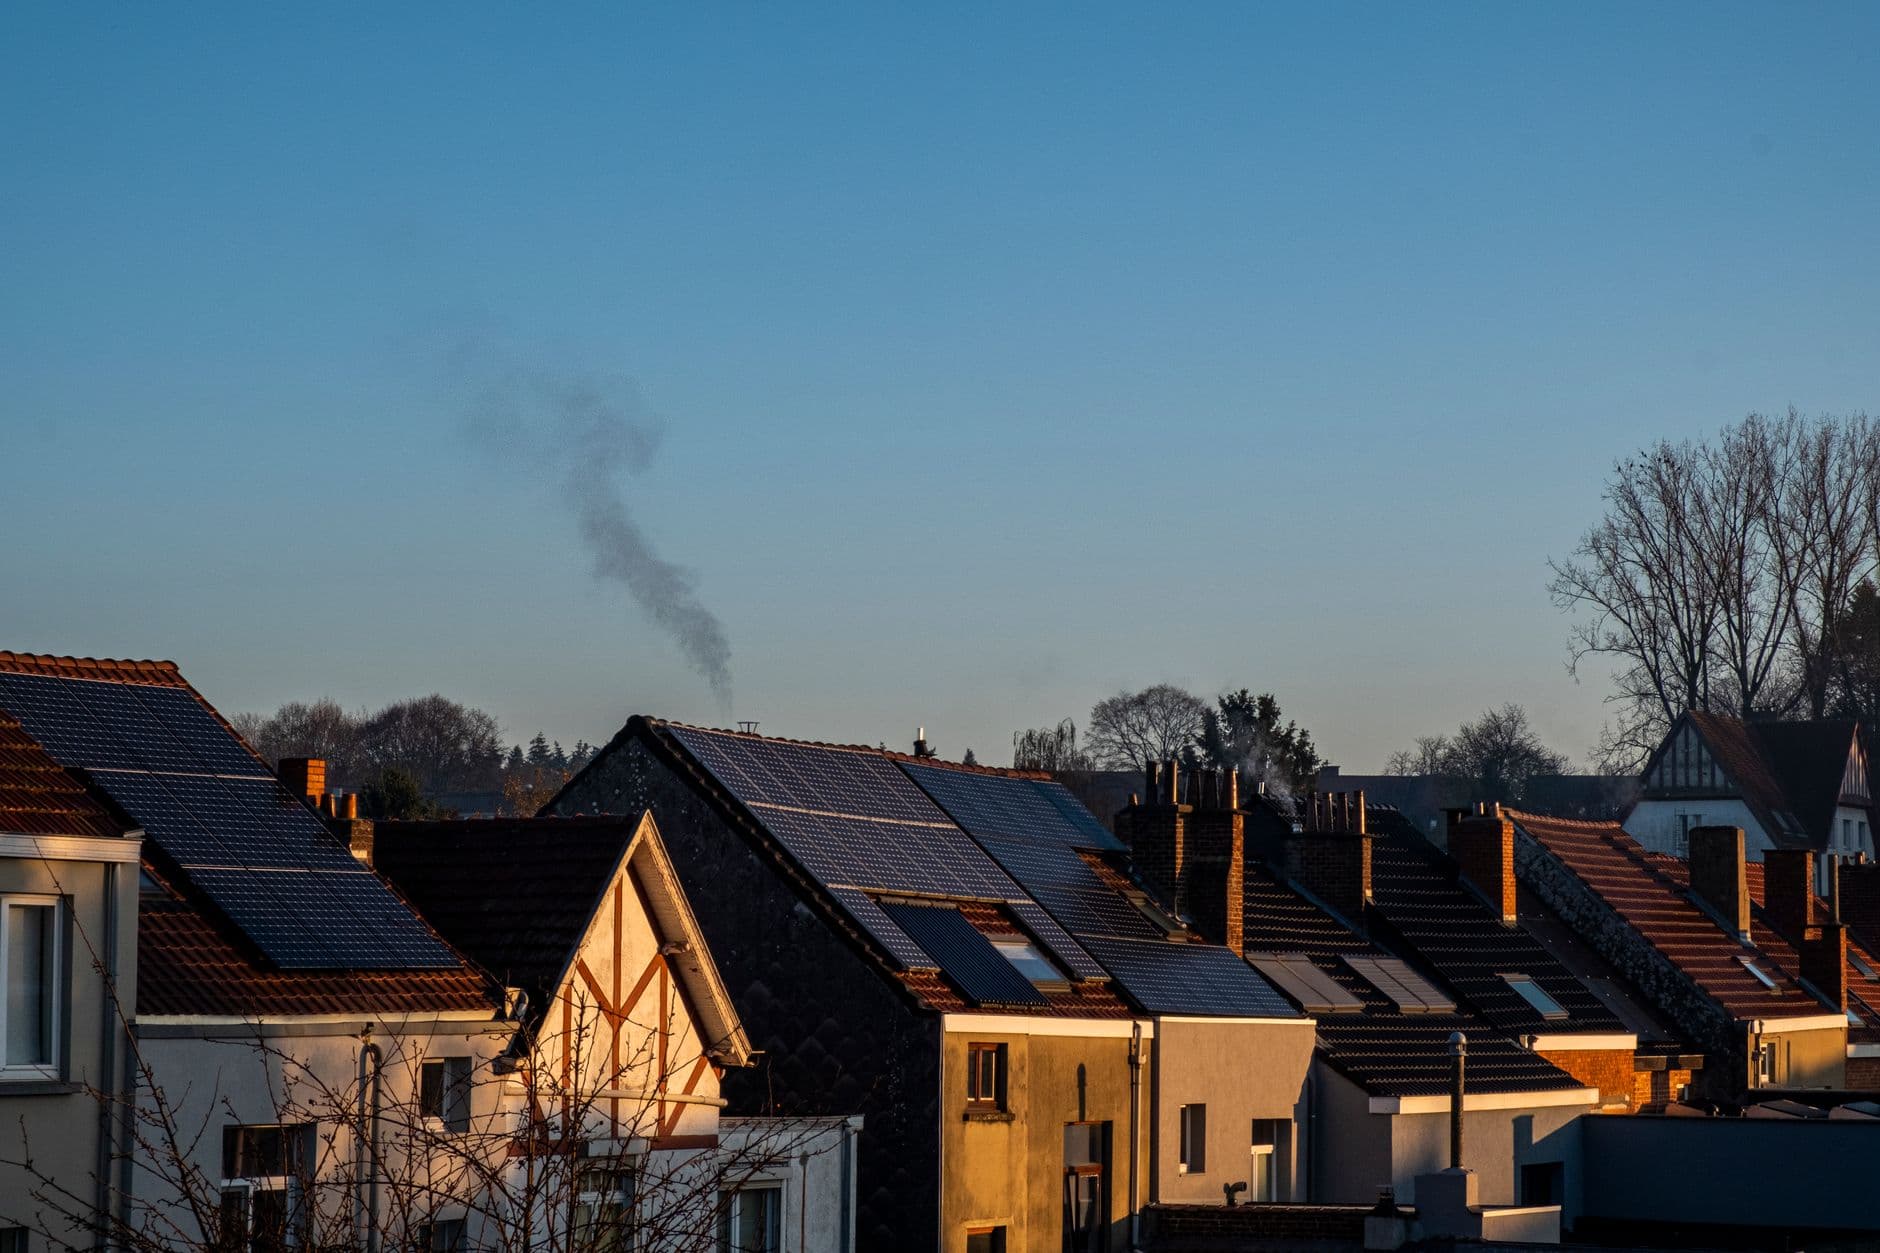
Solar’s rapid growth is powered by falling panel prices, expanding rooftop installations, and large‑scale utility projects. According to SolarPower Europe, EU solar capacity reached 406 GW in 2025, a figure that underpins the record generation levels.
What It Means for Israel
For Israeli households, the EU’s solar performance offers a useful benchmark. Using the typical Israeli residential tariff of ₪0.48 /kWh and a standard yield of 1,700 kWh/kWp / year for the central region, a 10 kWp home system would generate about 17,000 kWh annually – worth roughly ₪8,160 in electricity savings each year.
With a typical turnkey cost of ₪3,150 /kWp, the same system costs ₪31,500 to install. At the current tariff, the payback period is about 3.9 years, after which the system continues to produce clean energy for the remainder of its 25‑year lifetime. Compared with the EU’s 58.8 TWh quarterly output, Israel’s rooftop market is still modest, but the economics are similarly attractive: low‑cost panels, high solar irradiance, and generous feed‑in tariffs make residential solar a compelling investment.
For commercial and municipal customers, the higher yields in the southern and Arava regions (up to 2,200 kWh/kWp / year) can shorten payback to under 3 years, reinforcing the case for larger‑scale rooftop and ground‑mounted projects.
Looking Ahead
The EU’s renewable share is set to keep rising as wind and solar capacity additions continue. Ember projects a 20 % increase in EU solar generation in 2026 over 2025, driven by new installations and higher capacity factors.
Israel can learn from the EU’s policy mix – strong renewable targets, supportive financing, and grid‑integration measures – to accelerate its own goal of 30 % renewable electricity by 2030 (and 20 % by 2025). As solar prices keep falling worldwide, the economic case for expanding rooftop and utility‑scale solar in Israel becomes ever stronger.
Stay tuned for updates on how European trends translate into local opportunities, and explore our solar ROI calculator for a personalized payback estimate.
FAQ
- Q: How much electricity did EU solar generate in Q1 2026? A: 58.8 TWh, a record quarterly output.
- Q: What share of EU electricity was renewable in Q1 2026? A: 45.5 %, up from 42.7 % a year earlier.
- Q: Which EU country had the highest renewable share? A: Denmark, with 90 % of its electricity from renewables.
- Q: How does EU solar growth compare to Israel’s rooftop market? A: EU solar generated enough to power ~13 million homes in a quarter; a typical 10 kWp Israeli home system produces ~17,000 kWh/year, saving about ₪8,160 annually.
- Q: When will solar and wind out‑produce fossil fuels in the EU? A: They already did in 2025, and the trend is expected to continue.
- Q: What is the EU’s renewable energy target for 2030? A: At least 42.5 % of total electricity, per the 2023 Renewable Energy Directive.
Key Facts
- EU renewable electricity share hit 45.5 % in Q1 2026.
- Solar contributed 58.8 TWh, a 6.3 % rise over Q1 2025.
- Solar’s share of EU renewables rose to 17.3 %.
- Denmark led with 90 % renewable electricity.
- A typical 10 kWp Israeli home system saves ≈₪8,160 per year.
Meta
- metaTitle: EU Solar Hits Record 58.8 TWh in Q1 2026
- metaDescription: EU renewables supplied 45.5% of electricity in Q1 2026, with solar generating a record 58.8 TWh. What it means for Israel’s rooftop market.
- tags: ["solar energy","EU renewables","solar power","renewable electricity","Israel solar","energy policy"]
- imageKeywords: ["EU solar generation","renewable electricity chart","solar panels on rooftops","solar power statistics","Israel rooftop solar"]
- categoryKey: markets
Sources & further reading
FAQ
How much electricity did EU solar generate in Q1 2026?
58.8 TWh, a record quarterly output.
What share of EU electricity was renewable in Q1 2026?
45.5 %, up from 42.7 % a year earlier.
Which EU country had the highest renewable share?
Denmark, with 90 % of its electricity from renewables.
How does EU solar growth compare to Israel’s rooftop market?
EU solar generated enough to power ~13 million homes in a quarter; a typical 10 kWp Israeli home system produces ~17,000 kWh/year, saving about ₪8,160 annually.
When did solar and wind out‑produce fossil fuels in the EU?
They first overtook fossil fuels in 2025 and the trend is set to continue.
What is the EU’s renewable energy target for 2030?
At least 42.5 % of total electricity, per the 2023 Renewable Energy Directive.
Share this post
More from Markets
6
KKR's $4.2B EDF Deal Accelerates US Solar
KKR is buying EDF Power Solutions North America for about $4.2 billion, giving the firm a top‑ten U.S. renewable‑energy portfolio and marking its biggest clean‑energy investment yet.

South Korea to Add 4 GW Solar in 2026
South Korea will add about 4 GW of new solar capacity in 2026, matching 2025 levels, as the market pivots toward higher quality and long‑term sustainability.

India Could Install 85 GW Solar by 2030
India could boost annual solar installations from about 50 GW in FY 27 to nearly 85 GW by FY 30, spurred by data‑centres, green‑hydrogen and round‑the‑clock power demand.

Ireland to Top 3.3 GW Solar by Year‑End
Ireland is poised to add significant solar capacity by year‑end, driven by utility‑scale farms, a booming rooftop market and a €1,800 grant that remains in place.

אומן משיקה מכרז של 1.5 ג'יגה ווט סולאר
אומן פותחת מכרז של 1.5 GW סולארי, כולל פרויקט של 1 GW עם אחסון ו‑500 MW ללא אחסון, וההצעה נסגרת ב‑27 ביולי.

China’s Polysilicon Dip Lowers Solar Costs
Polysilicon prices in China slipped to an average of CNY 33,200/ton, wafer prices stayed flat, and a 5.4 GW N‑type module tender underscores strong demand. The dip could modestly cut Israeli rooftop solar costs, shortening pay‑back periods.